Expert Advisor Comparison · 2026
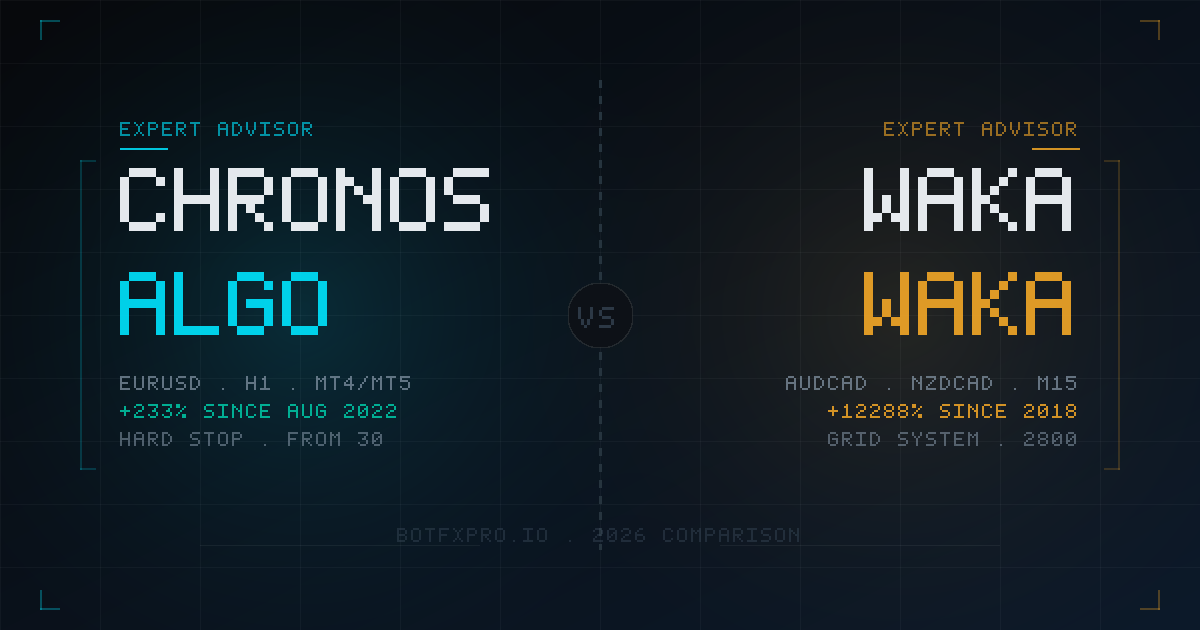
Chronos Algo vs Waka Waka
A Straightforward Comparison for Serious Traders
botfxpro.io · EURUSD / AUD-NZD crosses · Martingale basket systems · Verified live records
Waka Waka is one of the most recognized Expert Advisors on the MQL5 marketplace — with a live track record stretching back to 2018, verified on Myfxbook, and thousands of copies sold. Chronos Algo is a more recent EA from BotFXPro, live since August 2022, trading EURUSD on the H1 timeframe.
Both are martingale basket systems. Both have multi-year verified live records. But beyond that surface similarity, the two EAs differ significantly in strategy design, pairs traded, drawdown behavior, transparency — and price.
This article is a direct comparison. No marketing language. Just the numbers and the trade-offs that matter when deciding where to put real capital.
At a Glance
Chronos Algo
- EURUSD · H1 · MT4 + MT5
- Martingale basket strategy
- Hard portfolio stop at -65%
- 3+ years live · Myfxbook verified
- +233% gain since Aug 2022
- From $30 · lifetime license
Waka Waka
- AUDCAD, AUDNZD, NZDCAD · M15
- Grid + martingale strategy
- No fixed hard portfolio stop
- 7+ years live · Myfxbook verified
- +12,000%+ since Jun 2018 (signal)
- $2,800 · lifetime license
Strategy: How Each EA Actually Trades
Chronos Algo — Martingale Basket on EURUSD H1
Chronos Algo trades EURUSD on the 1-hour chart using a multi-indicator entry filter that requires agreement across Stochastic, ADX, MACD, RSI, CCI, ATR, and Envelopes before opening a position. This deliberate filtering reduces how often the EA enters the market, limiting the frequency of recovery sequences.
When the market moves against the initial position, the EA opens additional positions in the same direction with progressively larger lot sizes — a martingale basket. Exit logic is tiered: small baskets close at a profit target; larger baskets shift to breakeven exit, closing all positions the moment equity recovers to entry level.
A hard portfolio stop loss at -65% closes all open positions automatically if account drawdown reaches that threshold. The -65% floor defines the absolute worst-case outcome.
Waka Waka — Grid System on AUD/NZD Crosses
Waka Waka trades AUDCAD, AUDNZD, and NZDCAD on the M15 timeframe. These cross pairs were chosen for their tendency to range rather than trend aggressively, which suits grid-style recovery logic. The EA uses ML-based pattern recognition as an entry filter and opens additional positions at regular grid intervals when the market moves against the initial trade.
The developer describes the system as an “advanced grid system” rather than pure martingale, as lot sizes don’t always double. Risk is managed through position sizing controls rather than a fixed stop loss, meaning the EA can theoretically hold open positions indefinitely if the market trends strongly against it.
The Core Risk of Both Systems
Both Chronos Algo and Waka Waka share the same fundamental characteristic: they add to losing positions. In ranging or mean-reverting conditions, this works well. In sustained trending conditions — particularly sharp, one-directional moves — both systems can accumulate significant floating loss before recovering. Understanding this is essential before using either EA with real capital.
Risk Structure: Side by Side
| Factor |
Chronos Algo |
Waka Waka |
| Core strategy |
Martingale basket · trend entries |
Grid + martingale · ranging pairs |
| Martingale |
Yes — core, fully disclosed |
Yes — grid spacing, configurable |
| Per-trade stop |
No — basket managed as unit |
No — position sizing controls |
| Portfolio hard stop |
Yes — closes all at -65% |
No fixed hard stop (configurable) |
| Max drawdown (live) |
~33% (Myfxbook verified) |
~66% (signal account) |
| Worst-case outcome |
-65% (system closes at this floor) |
Theoretically -100% without risk limits |
| Pairs traded |
EURUSD only |
AUDCAD, AUDNZD, NZDCAD |
| Timeframe |
H1 |
M15 |
| Platforms |
MT4 + MT5 |
MT4 + MT5 |
The most significant structural difference is the hard portfolio stop loss. Chronos Algo will automatically close all positions if floating loss reaches -65% of equity — defining the worst-case outcome before you start trading. Waka Waka does not have an equivalent fixed floor in its default configuration.
Live Track Records
Chronos Algo
Cumulative Gain
+233%
Since Aug 2022 · MT4 live
Max Drawdown
~33%
Live recorded · hard floor -65%
Verified Withdrawals
$1,273
Verified on MQL5
Live Since
Aug ’22
3+ years continuous
Chronos Algo has been running on a live MT4 account since August 2022 with the same initial $1,000 deposit and no additional capital injections. Gains have been periodically withdrawn — $1,273.25 in verified MQL5 withdrawals as of 2026. An MT5 account was added in 2025 as a parallel live track record.
Waka Waka
Cumulative Gain
+12,288%
Since Jun 2018 · signal account
Max Drawdown
~66%
Signal account recorded
Abs. Gain
+458%
On total deposited capital
Live Since
Jun ’18
7+ years continuous
Waka Waka’s signal account (MischenkoValeria on MQL5) has been running since June 2018 — a genuinely long live record. Total deposits of $3,500 against withdrawals of $4,352 mean capital has been added at certain points in its history, which is important context when interpreting the cumulative gain percentage. Absolute gain on total deposited capital is approximately +458%.
A Note on Martingale Track Records
One inherent challenge when evaluating martingale-based EAs: the developer’s own account — which serves as the primary marketing asset — is managed with more flexibility than a typical user’s account. When markets trend strongly against open positions, a developer can choose to add capital, reduce risk settings, or close positions manually to prevent a reset. User accounts running default settings don’t have the same backstop.
This doesn’t mean the track record is invalid — but it’s a meaningful difference between what you see on the signal page and what your account will experience.
Monthly Returns & Value Comparison
| Metric |
Chronos Algo |
Waka Waka (signal) |
| Avg monthly gain |
~3% simple (Myfxbook) · ~5% compounded |
~5.2% (stated monthly, signal) |
| Profitable months |
~80% of months since Aug 2022 |
70+ consecutive profitable months (claim) |
| Worst single month |
Drawdown periods, no forced reset |
-84% recorded in one user account (May 2024) |
| License price |
From $30 (per account, lifetime) |
$2,800 (lifetime) |
Chronos Algo averages approximately ~3% per month on a simple basis according to Myfxbook. For accounts that reinvest returns without withdrawals, the compound monthly rate works out to roughly ~5% — comparable to Waka Waka’s stated ~5.2%. The break-even analysis below uses the conservative 3% simple figure.
Break-Even Analysis — $1,000 Account, ~3% Monthly
Chronos Algo ($30 starter): License recovered in 1 month. Net profit begins almost immediately.
Waka Waka ($2,800): License cost requires ~93 months of Chronos-equivalent returns to break even — before accounting for any drawdown periods.
For larger accounts ($10,000+), the proportional impact of the license cost decreases significantly for Waka Waka. At that scale, the decision shifts to track record depth and strategy preference.
Which EA Fits Which Trader?
| You want a defined worst-case loss before you buy |
Chronos Algo — the -65% hard stop defines the maximum outcome |
| You prefer AUD/NZD pairs and M15 timeframe |
Waka Waka — optimized specifically for those cross pairs |
| Starting with limited capital ($500–$2,000) |
Chronos Algo — $30 license, $1,000 minimum recommended capital |
| You value the longest possible live track record |
Waka Waka — 7+ years live, genuine market cycle history since 2018 |
| Running multiple accounts |
Chronos Algo — per-account pricing from $30 scales efficiently |
| You want verified withdrawals from the live account |
Chronos Algo — $1,273.25 in verified MQL5 withdrawals |
| You have $5,000+ and want a well-known system |
Either — evaluate strategy fit and drawdown tolerance at that capital level |
Final Verdict
Waka Waka is a legitimate, well-established EA with a longer track record than almost anything else in the retail market. Its 7+ years of verified live performance is genuinely unusual. If you’re choosing based on track record depth alone, Waka Waka has the edge.
Chronos Algo is newer, trades a single pair, and lacks the decade-long history. But what it offers in exchange is a clearly defined risk structure — a hard -65% portfolio stop that removes the ambiguity of open-ended drawdown — combined with a price point that makes it accessible to traders with modest capital.
For traders primarily concerned with understanding exactly what can go wrong before they start, Chronos Algo’s transparent risk floor is a genuine differentiator. For traders with larger accounts who want the longest possible verified history and are comfortable managing grid-based risk exposure, Waka Waka remains a credible option — provided capital is sized appropriately.
Neither system eliminates the fundamental risk of martingale and grid trading. Both can produce significant drawdowns in sustained trending conditions. That risk is built into the strategy — and is true of any EA in this category.
See Chronos Algo’s Full Live Track Record
3+ years live. Verified withdrawals on MQL5. Hard portfolio stop at -65%. From $30 lifetime.
View Chronos Algo →
Risk Disclosure: Both Chronos Algo and Waka Waka are martingale/grid-based systems. They can open multiple positions with progressively larger lot sizes during adverse market conditions. Past performance does not guarantee future results. The -65% hard stop loss in Chronos Algo limits but does not eliminate loss. All trading of leveraged instruments carries substantial risk of loss and may not be suitable for all investors. This article is for informational purposes only and does not constitute financial advice.