ATR Filter in Candlestick Trading:
Why Small Candles Give False Signals
Every candlestick pattern indicator produces too many signals. The pattern detection logic is not the problem — the geometric definitions for Pin Bars, Engulfing candles, and Morning Stars are well-established. The problem is that those definitions apply equally to a candle that formed during a high-volume institutional session and a candle that formed at 3am on a Tuesday with minimal participation. These two candles carry very different amounts of information, and treating them the same produces a noisy, unreliable signal stream.
The Average True Range (ATR) filter is the most effective tool for separating meaningful candlestick signals from noise. This article explains how ATR works, why candle size matters, and how to configure the filter in practice.
What ATR Measures
ATR is a 14-period average of the True Range, where True Range is defined as the largest of: the current high minus low, the absolute value of current high minus prior close, and the absolute value of current low minus prior close. The result is a single value representing the average price movement per candle over the last 14 periods, accounting for gaps.
ATR does not have a directional component — it only measures volatility. A high ATR means candles have been moving a lot. A low ATR means candles have been moving very little. Both conditions are normal at different times, which is what makes ATR a relative measure rather than an absolute one.
Why Candle Size Affects Signal Quality
Candlestick patterns encode information about supply and demand during a specific period. A Bullish Pin Bar signals that sellers drove price significantly below the open and buyers rejected that move decisively, pushing price back to near the open by close. This rejection story requires meaningful price movement to be informative. If the candle only moved 3 pips total, the “rejection” being signalled is essentially meaningless — 3 pips of movement can occur from spread changes alone.
The ATR provides a dynamic reference for what counts as “meaningful movement” for a given instrument at a given time. During a high-volatility period on EURUSD, the ATR might be 80 pips. A 15-pip candle represents only 19% of that — genuinely insignificant. During a quiet Asian session, the ATR might be 12 pips. A 10-pip candle represents 83% of ATR — a relatively significant move for that environment.
A pattern that forms on a candle smaller than 70% of the current ATR is making a small move in a normal-volatility environment. The rejection or momentum it signals is proportionally weak. Filtering these patterns out doesn’t eliminate good signals — it eliminates the low-quality ones that produce the most false entries.
How Price Action Patterns Pro Applies ATR Filtering
Price Action Patterns Pro uses a 14-period ATR and requires each pattern candle to have a range of at least 70% of the current ATR value (configurable via InpMinRangeATR). Patterns failing this check are silently excluded from the chart regardless of their geometric validity.
This threshold is not arbitrary. Analysis across major pairs shows that patterns with candle ranges below 70% ATR fail at a significantly higher rate than those at or above it. The quality improvement from this filter alone typically reduces false signals by 30–40%.
Configuring the ATR Filter
The default settings (ATR period 14, minimum range 70% of ATR) work well across most major pairs on H1 and higher timeframes. For lower timeframe analysis (M15, M30), consider raising the minimum to 80–90% of ATR to compensate for the additional noise that lower timeframes produce. For exotic pairs with naturally wider spreads, the 70% default is appropriate as-is.
Volume Filter: The Second Layer
ATR measures whether a candle moved enough. Volume measures whether enough participants were involved. A candle can meet the ATR size requirement and still have been driven by a single large order in a thin market rather than genuine broad participation.
The volume filter requires pattern candles to have volume at least 80% of the 20-period average (configurable via InpMinVolRatio). Sessions with below-average volume are filtered out even if the candle size passes the ATR check.
Together, ATR and volume filtering typically reduce the total signal count by 40–60% compared to unfiltered detection. The signals that remain are concentrated on the higher-quality formations where both candle size and market participation suggest the move has genuine meaning behind it.
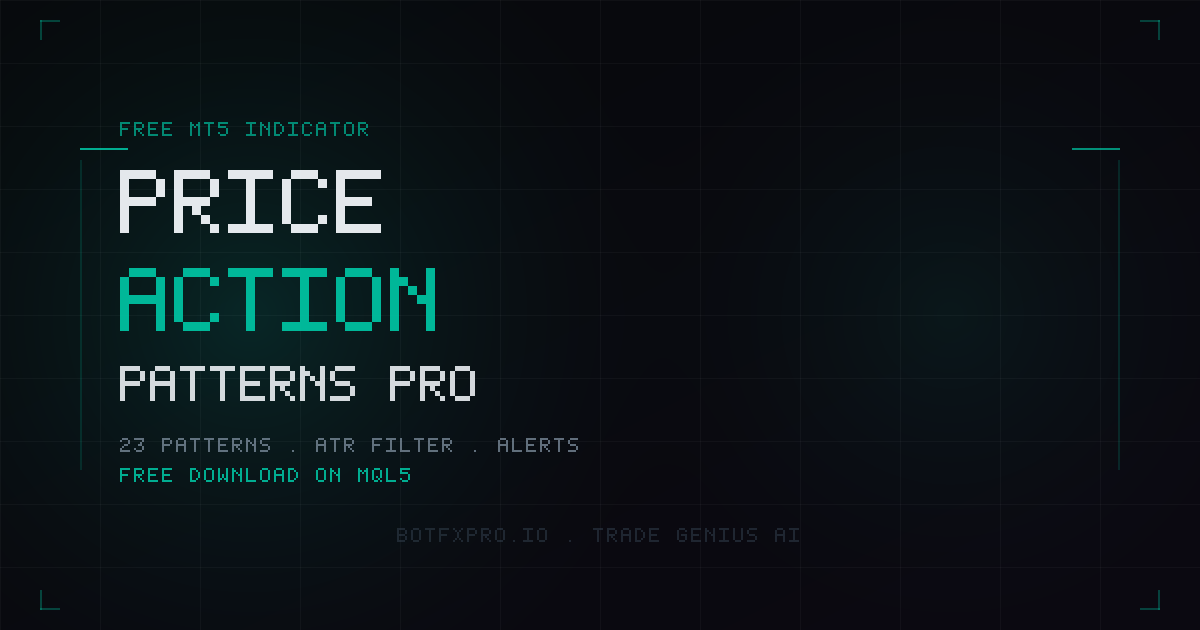
Price Action Patterns Pro — Free MT5 Indicator
ATR filter · Volume filter · 23 patterns · Push alerts · Free on MQL5
Free Candlestick Pattern Indicator for MT5: 23 Patterns with Alerts