EA Strategy · Risk Management · 2026
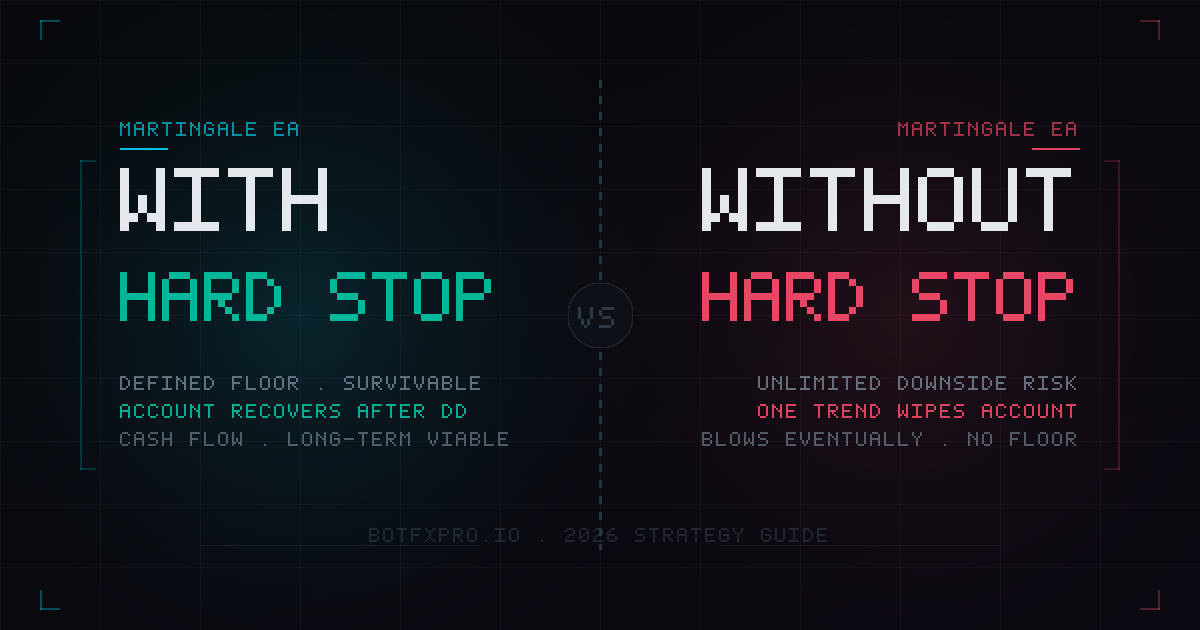
Martingale EA With a Hard Stop vs Without:
A Deep Dive for Serious Traders
botfxpro.io · Martingale risk structure · Hard stop loss · Cash flow strategy
If you’ve spent any time evaluating automated trading systems, you’ve encountered martingale. It’s one of the most polarizing strategies in retail forex — equally loved for its consistent short-term performance and feared for its catastrophic failure modes.
The debate around martingale usually focuses on the wrong things: win rate, monthly return, drawdown percentage. These metrics matter, but they don’t answer the most important structural question.
Does the system have a hard portfolio stop loss — and what happens when it triggers?
That single design decision creates a fundamental divide between two types of martingale EA. They can look nearly identical for months or years. Then, when an adverse market event arrives, one survives and one doesn’t. This article explains why — mechanically, mathematically, and practically.
How Martingale Actually Works: The Full Mechanics
Martingale originated as a gambling strategy. In forex trading, it translates into a position averaging system. When the market moves against the initial trade, the EA opens additional positions in the same direction with progressively larger lot sizes. When the market reverses and reaches the basket’s profit target, all positions close simultaneously at a net profit.
The mechanics create three distinctive characteristics:
- High win rate: Because most short-term adverse moves eventually reverse, the basket closes profitably the majority of the time. Win rates of 80–95% are common. This is real — not marketing.
- Asymmetric loss exposure: The losses that do occur are disproportionate. A single losing sequence can be 5×, 10×, or 20× the size of a typical winning trade. Win rate looks excellent right up until a deep losing sequence overwhelms the account.
- Correlation with market regime: Martingale performs well in ranging or mean-reverting conditions. It struggles severely in trending markets — particularly strong, sustained directional moves that don’t reverse before the basket grows too large.
The Mathematics of Position Scaling
A typical martingale EA doubles lot size with each additional position. Starting at 0.01 lots on a $1,000 account:
| Position |
Lot size |
Cumulative exposure |
Relative to initial |
| 1 (initial) |
0.01 |
0.01 |
1× |
| 2 |
0.02 |
0.03 |
3× |
| 3 |
0.04 |
0.07 |
7× |
| 4 |
0.08 |
0.15 |
15× |
| 5 |
0.16 |
0.31 |
31× |
| 6 |
0.32 |
0.63 |
63× |
| 7 |
0.64 |
1.27 |
127× |
| 8 |
1.28 |
2.55 |
255× |
By position 8, cumulative lot exposure is 255 times the initial position. This is the core danger: exposure grows geometrically while account balance grows linearly. A system with no ceiling on this process will eventually hit a market condition where geometric growth outpaces the account. Without a hard stop, the result is a margin call.
What a Hard Portfolio Stop Loss Actually Does
A hard portfolio stop loss places a ceiling on this geometric exposure. It defines, in advance, the maximum floating loss the system will tolerate before force-closing all positions.
Critically, this stop operates at the portfolio level, not the individual trade level. It monitors the combined floating loss of all open positions simultaneously. When total floating loss reaches the defined threshold — expressed as a percentage of account equity — every open position closes at once.
| |
Martingale without hard stop |
Martingale with hard stop |
| Monthly performance |
Similar |
Similar |
| Win rate |
80–95% |
80–95% |
| Worst case |
Account wipeout (-100%) |
Defined loss (e.g. -60 to -65%) |
| Account survival |
Not guaranteed |
Guaranteed floor |
| Resumable after drawdown |
No — account gone |
Yes — trading continues |
The monthly returns are comparable. The difference is entirely in what happens when things go wrong. It converts unlimited risk into defined risk, removes the margin call scenario, and forces the system to be honest about its actual risk profile.
All Three BotFXPro Martingale EAs Have Hard Stops
Every martingale EA on BotFXPro carries a hard portfolio stop loss. This is not optional or configurable — it’s a structural requirement.
Chronos Algo
EURUSD · H1 · MT4 + MT5
Entry filtered by 7-indicator confluence (Stochastic, ADX, MACD, RSI, CCI, ATR, Envelopes). Reduces trade frequency and limits sequences that reach deep recovery stages.
Live since August 2022 — 3+ years continuous. Verified withdrawals on MQL5. Hard stop never triggered in 12+ years of backtesting or live trading.
• Hard portfolio stop: -65%
Velocity & Sentinel MT5
USDCAD + AUDCAD · M15 · MT5
Two independent martingale systems running in parallel on deliberately low-correlation pairs. When USDCAD is in a drawdown sequence, AUDCAD is statistically unlikely to be in simultaneous deep drawdown.
The cross-pair design provides an additional layer of portfolio diversification beyond the hard stop itself.
• Hard portfolio stop: per system
QuantLot Expert
EURUSD · M15 · MT5
Hard portfolio stop at -60% with an additional cap of 8 recovery positions maximum. The position cap limits not just the loss floor but the exposure path that leads to it.
Unlike uncapped systems where position 15–20 is theoretically possible, exposure profile is fully defined by position 8.
• Hard portfolio stop: -60% · Max 8 positions
Why Backtest Quality Separates Serious Systems from Marketing Tools
Most retail EA vendors include a backtest. Very few use one that actually means anything.
The standard approach uses interpolated tick data — approximated price points that don’t reflect actual bid/ask spread behavior, requotes, or micro-volatility that real trading produces. This type of backtest can be generated in minutes, tuned to produce exceptional results, and presented as evidence of robustness. It isn’t.
The difference between a marketing backtest and a genuine one comes down to two variables: data quality and time horizon.
100% Real Tick Data
MetaTrader’s Strategy Tester offers three data quality options. Most published backtests use interpolated data because it runs faster and typically produces better-looking results.
Real tick data uses the actual historical tick-by-tick price feed — every price update the broker received during the test period. For a martingale system, this matters enormously. Martingale baskets are sensitive to short-term price behavior. Interpolated data smooths out spread widening during news events, volatility spikes at session opens, and real pip-by-pip movement during sustained trends. Real tick data doesn’t.
A backtest run at 100% real tick data quality cannot be gamed by smoothing. Either the system handled those market conditions or it didn’t. All BotFXPro EA backtests are run at 100% real tick data quality.
10+ Years of Test History
Martingale systems have a specific testing vulnerability: a short backtest can look excellent simply by avoiding the market conditions that would stress the system most. A 2-year backtest covering a calm, ranging period will produce impressive statistics. The same system run over 10–12 years will encounter multiple major trend events, currency crises, central bank interventions, and regime changes.
Chronos Algo has been backtested over 2013–2024 — a 12-year period that includes:
- The EUR/USD collapse of 2014–2015 (1,000+ pip sustained move)
- Brexit volatility in 2016
- COVID-related currency dislocations in 2020
- The sharp USD strengthening cycle of 2022
The -65% portfolio stop was not triggered once across any of these events. Maximum equity drawdown reached 32.40% — closely matching the live account’s ~33% recorded drawdown.
Backtest–Live Alignment: The Real Credibility Signal
The most meaningful backtest validation isn’t the backtest statistics themselves — it’s whether the live account behaves consistently with the backtest. A system fitted to historical data typically performs differently in live conditions. Parameters were optimized for past market structure, and when conditions change, the edge degrades. This is overfitting, and it’s the reason most EAs underperform their backtests significantly in live deployment.
Chronos Algo: Backtest vs Live Comparison
Backtest max equity drawdown (2013–2024): 32.40%
Live recorded max drawdown (Aug 2022–present): ~33%
This alignment — across a 3+ year live period including multiple market cycles — indicates the system’s logic reflects genuine market behavior, not historical curve-fitting. The -65% hard stop was calibrated on a backtest that accurately reflected real market conditions, which gives the floor genuine meaning rather than being an arbitrary number.
Martingale as a Monthly Cash Flow Engine
When managed correctly, a hard-stop martingale system has a specific financial advantage that few trading strategies can match: consistent monthly cash flow.
Because win rate is high and most baskets close profitably, the account grows in a relatively predictable pattern month over month. Chronos Algo has averaged approximately ~3% per month (simple average, Myfxbook) — or roughly ~5% compounded for accounts that reinvest without withdrawals.
This consistency makes hard-stop martingale EAs well-suited to a specific financial strategy: use the EA as a cash flow asset, not a pure growth investment.
The Capital Recovery Framework — $10,000 Example
Phase 1 — Compounding (approx. months 1–28)
At ~3% per month compounded, a $10,000 account reaches approximately $20,000 in roughly 24–28 months. At that point, withdraw $10,000 — the original deposit. The remaining $10,000 continues running.
Phase 2 — Free cash flow (month 29 onward)
With $10,000 running at ~3% monthly average, the account generates approximately $300 per month on a position where your original capital has been fully returned.
| Withdrawal frequency |
Accumulated before withdrawal |
Approximate amount |
| Monthly |
$300 |
$300 |
| Quarterly |
~$950 (with compounding) |
~$950 |
| Semi-annually |
~$2,000 |
~$2,000 |
| Annually |
~$4,300 (at 3% compounded) |
~$4,300 |
Leaving profits to compound between withdrawals accelerates growth of the base. By the semi-annual mark, the base has grown to ~$11,600, so the 6-month withdrawal exceeds a simple 6× monthly figure.
What “Zero Net Cost” Actually Means
Once you’ve withdrawn your original $10,000, the EA continues running on profit balance. The hard stop still exists — a -65% drawdown event would reduce the profit balance significantly — but the capital at risk is no longer money you originally invested. You’ve restructured the risk: from “money I need to protect” to “gains I can afford to risk further.” This doesn’t eliminate risk. It restructures it into a form that’s psychologically and financially much easier to manage.
Early Withdrawal: A Valid Alternative Strategy
The framework above assumes full compounding during Phase 1. But there’s a legitimate alternative: withdraw profits frequently from the start to reduce portfolio risk progressively.
This is the approach the Chronos Algo live account has used. Rather than compounding aggressively toward capital recovery, withdrawals were made regularly in the early months — $1,273.25 in total verified withdrawals from an initial $1,000 deposit over 3+ years. Capital recovery takes longer, but the live account balance at risk decreases steadily from the start.
| Strategy |
Best for |
| Compound fully, then withdraw capital in one event |
Traders who can tolerate sustained exposure while targeting full capital recovery |
| Withdraw regularly from the start |
Traders who want to reduce capital at risk progressively, or need current income |
| Hybrid — withdraw partial profits, leave remainder to compound |
Traders who want a balance of current income and base growth |
How to Verify Whether a System Has a Real Hard Stop
Before purchasing any martingale EA, verify the hard stop independently rather than taking the vendor’s word for it.
- Check the trade history on Myfxbook. Download the full trade history and look for the SL (stop loss) field. For a basket-level hard stop, individual trades may show no per-trade stop — that’s normal. Look for documentation of the portfolio-level trigger mechanism and threshold.
- Look at signal page comments and history. If the system has gone through a significant drawdown event, signal comments will usually show community discussion. Look for events where the portfolio stop triggered — this confirms the mechanism is real and actually fires under live conditions.
- Ask the vendor directly: “At what portfolio drawdown percentage do all open positions force-close? Is this handled by a server-side stop or by EA logic on the client terminal?” A vendor with a genuine hard stop answers this immediately and specifically. Vague answers about “risk management features” are a red flag.
The Question to Ask Any Martingale EA Vendor
“Does every trade have a hard stop loss defined at entry? At what portfolio drawdown percentage are all positions force-closed?”
If the answer is specific and documented, that’s a system worth evaluating. If the answer is vague — or if the trade history shows no stop loss values — that system carries unlimited downside risk regardless of how good the historical performance looks.
See All Three BotFXPro Hard-Stop Martingale EAs
Chronos Algo, Velocity & Sentinel MT5, and QuantLot Expert — each with a defined hard portfolio stop and 100% real tick backtests.
View All EAs →
Risk Disclosure: All martingale EAs described carry substantial risk of loss. Hard stop losses limit but do not eliminate loss — a -60% or -65% drawdown event results in significant reduction of account value. Past performance including verified live records and backtest results does not guarantee future results. The “zero net cost” cash flow framework described assumes the EA continues to perform at historical averages, which cannot be guaranteed. All trading of leveraged instruments may not be suitable for all investors. This article is for informational purposes only and does not constitute financial advice.