Tag: XAUUSD

  • Pip Value and Position Sizing: The Math Every EA Trader Must Know

    Risk Management · 8 min read

    Pip value is the dollar amount that one pip of price movement represents per lot traded. It sounds simple — but the calculation differs between pairs, and misunderstanding it leads to lot sizes that are either dangerously large or unnecessarily small.

    For EA traders in particular, understanding pip value is essential because the EA’s lot size setting translates directly into dollar risk per pip. Getting this number right means the difference between a correctly sized system and one that blows through its kill switch in the first major drawdown.


    Pip Value by Pair

    Pair Pip = ? Value / 0.01 lot Value / 0.1 lot Value / 1.0 lot
    EURUSD0.0001$0.10$1.00$10.00
    USDCAD0.0001~$0.073~$0.73~$7.30
    AUDCAD0.0001~$0.073~$0.73~$7.30
    XAUUSD (Gold)$0.01$0.10$1.00$10.00

    Note: USDCAD and AUDCAD pip values in USD are slightly lower than EURUSD because the Canadian dollar quote creates a division by the current CAD/USD rate. At USDCAD near 1.37, each pip on a 0.01 lot position is worth approximately $0.073 rather than $0.10.

    Practical Sizing Example: Chronos Algo on EURUSD

    For Chronos Algo’s 8-order adaptive martingale structure, the total pip value at maximum cycle depth (all 8 orders open) at 0.01 base lots is approximately $7.30 per pip. A 100-pip adverse move from order 1 to the kill switch level would represent approximately $730 in floating loss — which is why a $1,000 account at 0.01 lots is at the floor, and a $2,000-$3,000 account provides comfortable buffer.

    The Golden Rule of EA Lot Sizing

    Calculate from max drawdown, not from desired return

    Step 1: Find the maximum pip drawdown from the backtest (the worst peak-to-trough pip movement in the test period). Step 2: Multiply by pip value at your planned lot size. Step 3: This is your worst-case dollar loss. Step 4: Your account balance must support this loss without triggering the kill switch prematurely. If it does not, reduce lot size until it does.

    Auto-Lot vs Fixed Lot

    Many EAs offer an auto-lot feature that scales lot size proportionally as the account grows. Auto-lot compounds faster — but it also means every losing cycle is proportionally larger as the account grows. For conservative long-term operation, starting on fixed lots and manually increasing them after defined account growth milestones is safer than full auto-lot from day one.

    Try It on a Demo Account First

    All BotFXPro EAs include a free MQL5 demo. Run it in Strategy Tester before committing to live.

    Chronos Algo on MQL5 →
  • Gold (XAUUSD) EA Strategy: Why Trend-Following Works Where Martingale Fails

    Pair-Specific Deep Dives · Series C, Part 3 · 8 min read

    Gold is the most discussed instrument in retail trading and one of the most misunderstood for algorithmic systems. Many traders assume that what works on currency pairs will work on gold. Usually it does not — and the reasons why tell you something important about how to choose the right strategy for each instrument.

    This article explains how gold behaves differently from forex pairs, why trend-following strategies fit it better than mean-reversion, and what timeframes work best for systematic gold trading.


    How Gold Differs from Currency Pairs

    Currency pairs are driven by interest rate differentials — the relative economic strength of two countries. They tend to oscillate within ranges when those differentials are stable, and trend when they diverge significantly.

    Gold is different. It is priced in USD but driven by a completely different set of factors:

    • Real interest rates — gold moves inversely with real yields (nominal rate minus inflation). When real rates fall, gold rises.
    • Safe haven demand — geopolitical uncertainty, banking crises, and systemic risk events push gold higher regardless of interest rate conditions.
    • Central bank buying — sovereign gold purchases have been a structural driver of demand since 2022, with record buying from emerging market central banks.
    • USD correlation — gold is priced in USD, so USD strength typically suppresses gold prices. But during risk-off events, both can rise simultaneously.

    The result: gold trends more persistently and over longer durations than most currency pairs. When gold decides to move, it often moves significantly — 100-300 pip daily ranges on XAUUSD are common, versus 50-100 pips on EURUSD.

    Why Mean-Reversion Struggles on Gold

    Martingale and grid systems rely on the assumption that price will revert to a mean after moving away from it. On EURUSD, this assumption holds reasonably well over H1 timeframes because the pair’s drivers — two central banks with similar mandates — create natural equilibrium.

    Gold does not have the same equilibrium dynamic. When gold begins a trend — driven by falling real rates, safe haven demand, or central bank accumulation — that trend can persist for months or years without meaningful retracement. A martingale system trying to average into a counter-trend position on gold during these periods will exhaust its order limit before the market turns.

    The 2020 rally from $1,450 to $2,075 over eight months, and the 2024-2025 rally from $1,800 to $3,000+, illustrate how far gold can trend without giving mean-reversion systems a recovery opportunity.

    Why Trend-Following Works on Gold H1/H4

    Trend-following strategies — those that identify directional momentum and trade in the direction of existing trends — are structurally well-suited to gold for the same reasons that mean-reversion is not.

    On H1 and H4 timeframes, gold’s trends produce clear, tradeable momentum with enough structure to filter false signals. The H1 chart balances signal quality (more signal than daily) with noise reduction (less noise than M15 or M30).

    Why Not M15 on Gold?

    Gold’s large pip movements and wider spreads make M15 strategies expensive to run. A 3-5 pip spread on XAUUSD versus 0.5 pips on EURUSD means each trade costs 6-10x more relative to the pip target. On H1 and H4, targets are larger and spread costs become a smaller percentage of the expected move.

    The Gold Trend Accelerator Approach

    Gold Trend Accelerator uses a non-martingale structure — each position is independent, with its own entry logic and exit levels. This is intentional.

    On a trending instrument like gold, the goal is to capture extended moves — not to recover from losses by adding positions against the trend. The EA trades with the trend, uses proper stop losses on each position, and takes profit when targets are reached.

    The key difference versus the martingale EAs in the lineup:

    Gold Trend Accelerator (Trend-Following)

    • Hard stop loss on every trade
    • No recovery averaging — each position stands alone
    • Lower win rate (typically 40-55%) but positive expectancy through reward-to-risk ratio
    • Performs best during sustained directional moves
    • Underperforms in ranging, choppy gold conditions

    Chronos Algo (Adaptive Martingale)

    • No individual stop loss per trade
    • Recovery averaging when price moves against
    • High win rate (85-95%) but occasional large drawdowns
    • Performs best during ranging, mean-reverting conditions
    • Struggles during sustained trends

    The two approaches are complementary. A portfolio containing both — a trend-follower on gold and an adaptive martingale on EURUSD — may produce more consistent combined returns than either alone, because their best conditions differ.

    Account Requirements for Gold EAs

    Gold has much larger pip values than currency pairs. One pip on XAUUSD is $0.10 per 0.01 lot — identical to EURUSD. But gold moves in much larger pip ranges, so the effective dollar movement per day is higher.

    For a trend-following gold EA with hard stops, the key sizing consideration is the stop loss distance. A 50-pip stop on gold with 0.01 lots is a $5 risk per trade — manageable. But gold often needs 80-150 pip stops to clear normal intraday noise, which increases required capital accordingly.


    Next in the Pair-Specific Deep Dives Series

    Part 4: M15 vs H1 Timeframes for Forex EAs — how timeframe choice affects signal quality, spread sensitivity, and the number of trades per month.

    Publishing May 23, 2026

    Try It on a Demo Account First

    All BotFXPro EAs include a free MQL5 demo. Run it in Strategy Tester before committing to live.

    Gold Trend Accelerator on MQL5 →
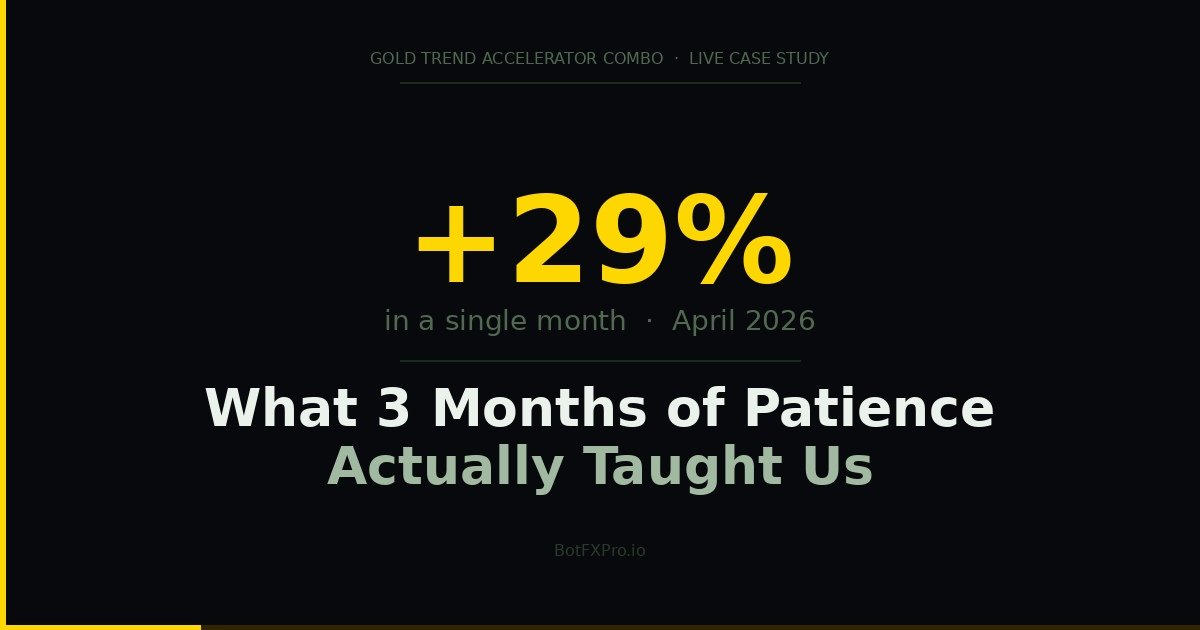
  • +29% in One Month: What 3 Months of Patience Actually Taught Us

    +29% in One Month: What 3 Months of Patience Actually Taught Us

    February 2026 came and went with almost nothing to show for it. -0.01%.

    March 2026 produced a small loss. -3.78%.

    If you had started running this EA in January and watched those two months pass, you might have started wondering — is it still working? Should I stop it? Did I choose the wrong system?

    April 2026 answered that question.

    April 2026
    +29%
    SINGLE MONTH
    3-Month Total
    +32.28%
    ABSOLUTE GAIN
    Max Drawdown
    16.81%
    ENTIRE PERIOD
    Live Profit
    $645.55
    FROM $2,000

    Every figure above is tracked and verified by a third-party platform connected directly to the live account. The account started with a $2,000 deposit in late January 2026 on a micro account.

    Why two “bad” months are not a warning sign

    Gold Trend Accelerator Combo runs seven independent systems simultaneously on a single XAUUSD chart. They split into two families:

    T-Systems (T1–T4) — Direct Trend
    Enter in the direction of the EMA crossover signal. Designed to capture sustained momentum in gold. Each system operates on its own timeframe — M30, H1, or H4 — with independently tuned EMA periods and ATR-based Stop Loss distances.
    R-Systems (R1–R3) — Counter Trend
    Enter opposite the EMA signal. Designed to profit from mean reversion. They perform well when gold overextends, reverses, or consolidates without breaking out cleanly.

    In February and March, gold moved without sustained direction. T-systems caught partial momentum moves but gave back gains when trends failed to extend. R-systems partially offset those losses — but the consolidation was not clean enough for strong reversal entries either.

    This is not system failure. This is the system waiting — absorbing an adverse period with contained drawdown rather than catastrophic loss.

    The monthly breakdown

    January
    +8.97%
    February
    -0.01%
    March
    -3.78%
    April ★
    +29%

    What April 2026 actually demonstrates

    April saw sustained directional movement in gold. The T-systems fired consistently into those conditions:

    • T3 on H1 — fixed TP structure locked in profits at predefined ATR-based targets as each momentum wave completed
    • T1 on M30 — trailing stop extended gains as intraday trends stretched further than expected
    • T4 on H4 — positioned into the larger structural move on the higher timeframe

    The R-systems were quieter in April — fewer counter-trend entries triggered. This is correct behaviour. In a trending market, the counter-trend systems reduce activity. Their silence in April is not underperformance — it is discipline.

    The result: +29% in a single month — not from excessive risk, but from T-systems firing efficiently into the conditions they were designed for.

    Three lessons from these three months

    Lesson 1 — Monthly results are the wrong lens
    February at -0.01% tells you nothing meaningful about system quality. It tells you the market was not cooperative that month. A good system survives the bad months and profits in the good ones — it does not profit every single month.
    Lesson 2 — Controlled drawdown is a feature, not a flaw
    -3.78% in March sounds unpleasant. Compare that to a martingale or grid EA in the same conditions — a bad month can mean -30% or a blown account. A system with a hard Stop Loss on every trade absorbs difficult months without destroying the account.
    Lesson 3 — Patience has a dollar value
    Anyone who stopped the EA in March missed +29% in April. One decision made from short-term anxiety can erase months of compounding in an instant. The system design only works if you give it time to work.

    How the system works — overview

    • Entry: EMA crossover, individually tuned per system and timeframe (M30, H1, H4)
    • Stop Loss & Take Profit: ATR-based — adjusts automatically to real market volatility
    • Trailing Stop: Selective — T1, T2, R3 use trailing stops; T3, T4, R1, R2 use fixed TP
    • Position sizing: One position per system max; lot size = % of account balance based on SL distance
    • Installation: Single XAUUSD chart — all 7 systems and 3 timeframes managed internally

    No grid. No martingale. Every trade carries a hard Stop Loss sent to the broker server at entry.

    Who this system is — and is not — designed for

    If you are looking for an EA that produces consistent gains every single month, this is probably not the right fit. Gold Trend Accelerator Combo is designed for traders who understand that real alpha often arrives in batches, who can accept a small controlled drawdown during unfavourable periods, and who think in multi-month terms.

    If you want a system with no grid, no martingale, a hard Stop Loss on every trade, multi-timeframe coverage from a single chart, and a verified live track record — this is worth a serious look.

    View Gold Trend Accelerator Combo →

    Past performance is not indicative of future results. Trading involves risk. Always test on a demo account before going live.