Tag: Forex Trading

  • How to Trade Pin Bars and Engulfing Candles: A Practical MT5 Guide

    How to Trade Pin Bars and Engulfing Candles: A Practical MT5 Guide

    Price Action · MT5 Guide · 2026

    How to Trade Pin Bars and Engulfing Candles:
    A Practical MT5 Guide

    botfxpro.io · Pin bar trading · Engulfing pattern · MT5 price action

    Pin bars and Engulfing candles are the two most traded candlestick patterns in retail forex. Between them they account for the majority of price action setups taken by professional technical traders. Understanding not just what they look like, but why they form and what market conditions make them reliable, is the difference between using them profitably and generating random entries with candle-shaped labels.


    Pin Bars: Rejection Signals

    A Pin Bar is defined by three geometric rules: the wick must be at least 70% of the total candle range, the body must be no more than 20% of range, and the opposing wick must be no more than 15% of range. What these rules describe is a candle where price moved aggressively in one direction, then completely reversed by close — the wick records where the move went, and the small body records where it ended up.

    The market story behind a bullish pin bar (long lower wick): sellers drove price significantly below the open during the session. At some point, buyers entered with enough force to push price back up to near the open level by close. The long lower wick is the evidence of that rejection — sellers tried to take the market lower and failed.

    What Makes a Pin Bar High-Quality

    The geometric definition is necessary but not sufficient. High-quality pin bars share these additional characteristics:

    • Location at a significant level. A pin bar rejecting from a major support or resistance zone, a daily moving average, or a previous swing high/low is a meaningful signal. The same pattern forming in open space with no technical significance is noise.
    • Candle size relative to ATR. A pin bar on a candle smaller than 70% of the current ATR has limited momentum behind it. The ATR filter in Price Action Patterns Pro removes these automatically.
    • Volume confirmation. The session that produced the pin bar should have above-average volume, indicating genuine market participation in the rejection move.
    • Timeframe. Daily and H4 pin bars carry significantly more weight than M15 or M5 formations. Higher timeframes represent more market participants and more informed decisions.

    Entering on a Pin Bar

    Two common entry methods exist. The first is entering at the open of the next candle after the pin bar closes — this gets you in early but risks entering before the setup is fully confirmed. The second is waiting for a break of the pin bar’s nose (the end of the opposing short wick) — this provides confirmation but at a worse entry price. Stop loss placement sits beyond the tip of the pin bar’s long wick, with enough buffer for spread and volatility.


    Engulfing Candles: Momentum Shifts

    An Engulfing pattern requires a two-candle sequence where the second candle’s body completely engulfs the first candle’s body by at least 110%. The engulfing ratio requirement is important: a second candle that just barely exceeds the first shows marginal momentum. A second candle that engulfs by 150% or more shows decisive momentum.

    The psychological dynamic: the first candle establishes a directional move. The second candle reverses that move and then goes significantly further in the opposite direction. Sellers who entered on the first candle are now underwater. This creates pressure to cover positions, which adds to the momentum of the reversal.

    Bullish vs Bearish Engulfing

    A Bullish Engulfing forms in a downtrend: a smaller bearish candle followed by a larger bullish candle whose body exceeds the first. It signals that buyers have overwhelmed the selling pressure that produced the prior candle. For the setup to be valid, the pattern should form at the end of a defined downtrend, not in the middle of a sideways range.

    A Bearish Engulfing forms in an uptrend with the same logic reversed: a smaller bullish candle followed by a larger bearish candle engulfing it. The most powerful bearish engulfing patterns appear at significant resistance levels where price has failed before.

    Using ATR and Volume with Engulfing Patterns

    Engulfing patterns are subject to the same quality filters as any candlestick pattern. The engulfing candle should be large relative to recent ATR — a small engulfing pattern on low-volume, low-volatility candles provides a weak signal. Price Action Patterns Pro applies both ATR and volume filters automatically, ensuring only engulfing patterns with genuine momentum behind them are marked.

    Pin Bar vs Engulfing: When to Prefer Each

    Pin bar signals rejection at a level — price tried to go there, failed decisively, and closed away from it. Best at clear support/resistance where price has bounced before.

    Engulfing signals momentum shift — one side established direction, the other completely overwhelmed them. Best after a clear trend move where you expect exhaustion.

    Spot Pin Bars and Engulfing Patterns Automatically

    Price Action Patterns Pro detects both patterns with ATR + Volume filters. Free on MQL5.

    Download Free on MQL5 →

    Disclaimer: Pattern signals are for analysis purposes only. Past pattern performance does not guarantee future results.
  • Trading Through News: Three Strategies, Three Risk Profiles

    Education · News Trading · 9 min read

    High-impact news releases — NFP, FOMC, CPI, GDP — produce some of the largest single-candle moves in any market. They also produce some of the largest single-account blow-ups in retail trading. The same volatility that creates opportunity destroys traders who approach it without a clear strategy and risk profile.

    There is no single “right way” to trade through news. There are three structurally different approaches, each with its own logic, risk profile, and required setup. Most retail blow-ups happen because traders use the wrong approach for their actual edge — they think they are using one strategy when their behavior matches another, and the risk math does not match what they assume.

    This article walks through the three approaches honestly, including what each one actually costs, when each one works, and which traders should avoid news entirely.

    The Core Insight

    News strategies fail when traders mismatch their risk profile to the approach. A trader running “trade the spike” sizing while actually behaving like “fade the move” loses money on both ends. The strategy is one decision; the position size and stop placement that match it are equally important.

    Why News Is Different

    During normal trading hours, price moves smoothly through liquid markets. Spread is tight. Slippage is small. Stops fire reliably at the price you set.

    During the 30 seconds around a major release, every one of those properties breaks. Spread can widen 5-10x. Liquidity vanishes for tens of seconds. Stop orders fill at whatever the next available price is — which can be 20, 50, or 200 pips away from your set level. Pending orders may not trigger at all if price gaps through them.

    All of the cost dynamics covered in Spread, Slippage, and Commission apply at extreme magnitudes during news. The 1-pip spread you usually pay becomes 5-8 pips. The 0.3-pip slippage becomes 10-30 pips. The cost structure of a news trade is fundamentally different from a normal trade — and any sizing math you use must account for that.

    EURUSD COST STRUCTURE — NORMAL vs NEWS

    Normal session : spread 1 pip, slippage 0.3 pip

    News window : spread 4-8 pips, slippage 5-30 pips

    Effective cost : ~10x normal during release window

    Strategy 1: Avoid (The Default)

    For most retail traders, the right news strategy is to not have one. Close all positions 15 minutes before high-impact releases on the trade’s instrument or its correlated cluster, do not open new positions until 15 minutes after, and let the news event happen without you in the market.

    This sounds boring, but it is mathematically correct for any strategy whose edge is technical pattern recognition rather than news interpretation. The volatility expansion during news is not your edge — it is just risk you are exposed to without compensation. Avoiding it removes a tail risk that can wipe out a month of disciplined gains in a single 30-second window.

    Risk Profile

    Zero exposure during release windows. Same expectancy as your base strategy minus a small opportunity cost from missing potential entries during avoided periods. For most traders, this opportunity cost is far smaller than the slippage and gap risk they would face.

    When This Is Right

    If you are running a swing strategy, a trend-following system, or any approach where your edge does not specifically come from interpreting news, this is the optimal choice. It is also the right choice for any prop firm trader since the asymmetric daily limit penalties make news exposure structurally unfavorable. The reasoning behind this is the same reasoning covered in The Drawdown Math Every Prop Firm Trader Should Know — when downside risk is asymmetric, you cannot afford the variance.

    Strategy 2: Position Through (Wider Stop, Smaller Size)

    Some strategies require holding positions across news events — overnight swing trades, multi-day position trades, or technical setups that happen to coincide with a release. The “position through” approach accepts that the news will affect the trade and structures the position to survive whatever happens.

    The Sizing Adjustment

    A trade you would normally size at 1% risk should be sized at 0.3-0.5% if held through high-impact news. The reason: your effective stop distance during news execution is 2-3x wider than your set stop, because slippage on the fill will exceed your planned loss. Sizing at 0.3% means even a 3x slippage event still keeps you within your normal 1% risk envelope.

    SIZING THROUGH NEWS — $10K ACCOUNT

    Normal trade risk : 1% = $100

    Stop set at 30 pips : $100 risk

    News slippage 3x : effective stop ~90 pips

    Actual realized loss : $300 (3% of account)

    Sized at 0.3% instead : realized loss capped at ~1%

    The Stop Adjustment

    If your strategy uses ATR-based trailing stops, the news-time ATR will already be wider — the indicator is doing its job. If you use fixed-pip stops, you should manually widen them by 2-3x for positions held through high-impact news, then tighten back after the dust settles. The trade-offs between fixed-pip and ATR-based trailing during volatile periods are covered in ATR Trailing vs Fixed Pips.

    When This Is Right

    Position trades that legitimately span days or weeks. Swing trades where closing before news would lock in unnecessary loss because the technical thesis is still valid. Strategies on instruments less affected by the specific release (e.g., AUDJPY through US CPI is less impacted than EURUSD).

    Strategy 3: Trade the Spike (Highest Risk, Highest Variance)

    The active news strategy: enter immediately after the release based on the data print and price reaction, ride the move for a few minutes, exit. This is the approach that produces the YouTube clips of “I made 5R on NFP in 90 seconds.” It also produces most of the news-related blow-ups that make those traders disappear from the platform six months later.

    What This Actually Requires

    To trade the spike profitably you need three things that most retail traders do not have: a fast reliable broker, real understanding of how the specific release moves the market, and the discipline to size correctly given that any single trade can fill 30+ pips off your intended price.

    Most traders fail at the third one. They size as if they can control execution, then discover that on the trade where they were right about direction, slippage cost them 60% of the move they captured.

    SPIKE TRADE — REALISTIC EXPECTATIONS

    Intended entry : 1.0850 (right after print)

    Actual fill : 1.0867 (17 pips slippage)

    Move captured : 40 pips total

    After slippage in/out : ~15 pips realized

    Edge captured : ~37% of paper move

    Sizing Math for Spike Trades

    Because slippage is unpredictable in both directions and magnitude, position sizing for spike trades should assume worst-case execution. A trader running 1% normal risk should plan around 0.2-0.3% target risk on spike trades, knowing that the actual realized risk will likely be 0.5-0.7%. If you size at 1% expecting 1% risk, you will eventually hit a 4-5% loss event when slippage compounds with stop failure.

    When This Is Right

    Honestly: rarely. Spike trading is positive expectancy only for traders who have built specific edge in interpreting one or two specific releases (an experienced macro trader who knows exactly how NFP surprises move EURUSD, for example). For everyone else, the variance is too high to trust the math even when the expectancy is technically positive on paper.

    The Honest Diagnostic

    If you have not specifically backtested a spike strategy on at least 30 instances of the same release type with realistic slippage assumptions, you are not trading the spike — you are gambling on it. The strategy works for a specific kind of trader; it is not a general retail approach.

    The Calendar Discipline

    Whichever strategy you pick, all three depend on actually knowing what news is scheduled. Most retail blow-ups during news events happen because the trader simply did not check the calendar — they walked into a CPI release without realizing it was about to drop.

    A simple discipline that handles this: at the start of every trading session, check the economic calendar for the next 8 hours. Note any high-impact releases on currencies you trade or correlated instruments. Plan your behavior around those events before the session starts, not when you suddenly see spread blow out.

    For pairs trading, remember that news on one currency affects the entire dollar cluster, the entire risk-on cluster, or the entire commodity cluster as appropriate. The mechanics are covered in Multi-Symbol Correlation Risk — but the practical application here is that “no positions through US CPI” usually means flat across all dollar pairs and major indices, not just EURUSD.

    The Tools That Make This Mechanical

    Avoiding news exposure manually requires you to remember every release on every currency you trade, calculate which positions to close, and execute the closes before the volatility window opens. In practice, traders skip these steps during busy sessions and end up exposed to events they intended to avoid.

    A trade management EA with session filtering and max-spread protection automates the mechanical parts of news avoidance. When spread spikes during a news release, max-spread filter blocks new entries automatically. When you configure session filters, the EA refuses to take trades during periods you have flagged as high-risk.

    RiskFlow Pro includes max-spread filtering and session control that handle the mechanical layer of news risk management — block entries when current spread exceeds threshold, restrict trading to specific session windows, and pair this with automatic daily drawdown protection so a slippage event during news cannot break your daily limit. The full configuration including how session filtering interacts with the four risk modes is covered in the Advanced Features guide.

    Decision Framework

    A simple rule for picking the right strategy:

    • Day trader, technical edge, no news interpretation skill → Strategy 1 (Avoid). Close 15 minutes before, reopen 15 minutes after.
    • Swing trader, multi-day positions → Strategy 2 (Position Through) with size cut to 0.3-0.5% normal.
    • Prop firm trader → Strategy 1 always. Asymmetric daily-limit penalties make news exposure structurally bad.
    • Position trader on H4/Daily → Strategy 2, with very small size and wider stops, or Strategy 1 if the timeframe permits closing.
    • Specialist with documented edge on specific releases → Strategy 3, with size at 1/5 of normal until you have 50+ live executions confirming the edge.
    • Anyone else considering Strategy 3 → Switch to Strategy 1.

    Key Takeaways

    • News volatility is risk you are exposed to without compensation unless news interpretation is your specific edge.
    • Three strategies: Avoid (default), Position Through (smaller size, wider stop), Trade the Spike (specialist only).
    • Effective transaction cost during news is roughly 10x normal — this must factor into any sizing math.
    • Position-through sizing should be 0.3-0.5% of normal risk per trade to absorb expected slippage.
    • Spike trading requires specific documented edge on specific releases, plus 50+ live executions before scaling up.
    • Always check the economic calendar at session start — most news blow-ups happen because the trader did not know about the release.
    • News on one currency affects the entire correlated cluster, not just the headline pair.

    Get RiskFlow Pro

    Max-spread filter. Session control. Daily drawdown protection.

    Block entries when spread spikes. Restrict trading to safe windows. Built for surviving news volatility on any broker.

    Download Free on MQL5 →

    For session filtering and max-spread setup, read the Advanced Features Guide.

  • 23 Price Action Patterns Every Forex Trader Should Know (With Free MT5 Indicator)

    23 Price Action Patterns Every Forex Trader Should Know (With Free MT5 Indicator)

    Price Action Guide · MT5 · 2026

    23 Price Action Patterns Every Forex Trader Should Know
    (With Free MT5 Indicator)

    botfxpro.io · Candlestick patterns · Price action trading · MT5

    Candlestick patterns are the vocabulary of price action trading. They encode the balance between buyers and sellers within a defined period — and when they appear at the right location, they offer high-probability clues about where price is likely to go next.

    This guide covers all 23 patterns detected by Price Action Patterns Pro, a free MT5 indicator, organized from single-candle formations to complex three-candle reversals. For each pattern, we cover what it signals, the geometry that defines it, and what to look for before acting on it.


    Single-Candle Patterns

    Single-candle patterns are the foundation of price action reading. They capture the story of one session: where price opened, how far it moved in each direction, and where it closed.

    1. Pin Bar

    The Pin Bar is the most widely traded single-candle pattern in retail forex. Its defining characteristic is a long wick (at least 70% of the total candle range) with a small body (no more than 20% of range) and minimal opposing wick. A bullish pin bar has a long lower wick, indicating that sellers drove price down significantly before buyers rejected that move and pushed price back up. A bearish pin bar has a long upper wick with the same logic reversed.

    Pin bars are most meaningful at key support and resistance levels, moving average confluences, or previous swing highs and lows. A pin bar forming in the middle of a range with no technical significance is a low-quality signal.

    2. Dragonfly Doji

    The Dragonfly Doji has a near-zero body (open and close at the same price) with a long lower wick occupying at least 85% of the candle range. It signals that sellers dominated the session initially, pushing price far below the open, before buyers completely recovered the loss. The psychological message is clear: sellers tried and failed decisively. At support levels, this is a high-confidence bullish reversal signal.

    3. Gravestone Doji

    The mirror image of the Dragonfly: a near-zero body with a long upper wick taking up at least 85% of range. Buyers pushed price aggressively higher before sellers reversed the entire move back to the open. At resistance levels, the Gravestone Doji is one of the stronger bearish reversal signals in single-candle analysis.

    4. Doji

    A Doji has a body smaller than 5% of range with wicks on both sides. It represents complete indecision — neither buyers nor sellers won the session. Dojis in trending conditions can signal exhaustion. In ranging conditions, they confirm the lack of directional conviction. They are most useful as a component of multi-candle patterns (Morning Star, Evening Star) than as standalone signals.

    5. Spinning Top

    Similar to the Doji but with a slightly larger body (up to 30% of range) and wicks on both sides. Like the Doji, it signals indecision and is most useful in context rather than isolation.

    6 & 7. Hammer and Hanging Man

    These two patterns are geometrically identical: a lower wick of at least 60% of range, a body between 10–35% of range, and an upper wick of no more than 10%. The difference is context. A Hammer appears after a downtrend and signals a potential bullish reversal. A Hanging Man appears after an uptrend and signals a potential bearish reversal. Same candle, opposite signals depending on where it appears.

    8 & 9. Inverted Hammer and Shooting Star

    The same context-dependent relationship applies here. Both have a long upper wick (>60% of range), a body between 10–35%, and a lower wick of no more than 10%. An Inverted Hammer after a downtrend signals potential bullish reversal. A Shooting Star after an uptrend signals potential bearish reversal.

    10 & 11. Bullish and Bearish Marubozu

    Marubozu candles have a body exceeding 90% of range with virtually no wicks. They represent the most decisive sessions possible — one side completely dominated from open to close without significant opposition. A Bullish Marubozu signals strong continuation or reversal momentum depending on context. A Bearish Marubozu carries the same weight in the opposite direction.


    Two-Candle Patterns

    Two-candle patterns require a specific relationship between consecutive candles. They are generally more reliable than single-candle patterns because they show how the market responded after the first candle closed.

    12 & 13. Bullish and Bearish Engulfing

    Engulfing patterns require the second candle’s body to completely engulf the first candle’s body by at least 110%. After a downtrend, a Bullish Engulfing (large bull candle swallowing a smaller bear candle) signals buyers have taken decisive control. After an uptrend, a Bearish Engulfing signals the opposite. The engulfing ratio requirement filters out weak formations where the second candle barely exceeds the first.

    14 & 15. Bullish and Bearish Harami

    The Harami is the opposite of Engulfing: the second candle’s body must be contained inside the first candle’s body, at no more than 50% of its size. A large bearish candle followed by a small bullish candle entirely within its range signals that the selling momentum has stalled. Traders watch for confirmation on the following candle before acting.

    16 & 17. Tweezer Bottom and Top

    Tweezer patterns occur when two consecutive candles share a matching low (Tweezer Bottom) or matching high (Tweezer Top) within a few pips tolerance. The matching extreme shows a price level where the market has tested and rejected in both candles — establishing a temporary support or resistance. At significant levels, Tweezers can mark precise turning points.


    Three-Candle Patterns

    Three-candle patterns provide the strongest signals in candlestick analysis because they show a progression over three sessions: the original trend, a period of indecision or transition, and confirmation of the reversal or continuation. Fewer false signals, but they form less frequently.

    18. Morning Star

    The Morning Star is a three-candle bullish reversal pattern. First candle: a large bearish candle (body >65% of range) confirming the downtrend. Second candle: a small-bodied indecision candle (body <30%) signaling the trend may be exhausting. Third candle: a large bullish candle closing more than 50% into the body of the first candle. The penetration requirement ensures the reversal has genuine momentum, not just a brief bounce.

    19. Evening Star

    The bearish counterpart of the Morning Star. Large bullish first candle, small indecision second candle, then a large bearish third candle closing more than 50% into the first candle’s body. One of the most reliable reversal patterns in technical analysis when it appears at significant resistance.

    20. Three White Soldiers

    Three consecutive bullish candles, each with a body exceeding 55% of range and an upper wick of no more than 15%. This pattern signals sustained buying pressure across three sessions — one of the stronger continuation signals after a breakout or reversal. The small upper wick requirement ensures buyers maintained control to near the close on each candle, without significant late-session selling.

    21. Three Black Crows

    Three consecutive bearish candles meeting the same body and wick criteria in the opposite direction. Signals sustained selling pressure and is particularly significant when it appears after a prolonged uptrend or failed breakout attempt.

    22 & 23. Three Inside Up and Three Inside Down

    These patterns begin with a Harami (two-candle indecision) and add a third candle that confirms the reversal direction. Three Inside Up: Bearish candle, bullish Harami candle inside it, then a third bullish candle closing above the first candle’s open. Three Inside Down: the bearish equivalent. The third candle confirmation makes these more reliable than the Harami alone.


    How to Use These Patterns Effectively

    Candlestick patterns work best when combined with these principles:

    • Location matters more than the pattern itself. A perfect pin bar in the middle of a range is a weaker signal than an imperfect pin bar at a key support level. Always ask: where is this pattern forming relative to significant price levels?
    • Use the ATR filter. Patterns forming on undersized candles are noise. A candle must be large enough relative to recent volatility to carry genuine momentum information.
    • Volume confirms conviction. Patterns backed by above-average volume represent sessions where genuine market participation drove the move. Low-volume patterns are more likely to reverse.
    • Higher timeframes carry more weight. A Bearish Engulfing on the daily chart is a more significant signal than the same pattern on a 5-minute chart, because it represents a full day of market activity rather than a few minutes.
    Detect All 23 Patterns Automatically

    Price Action Patterns Pro detects all 23 patterns described in this guide with ATR and Volume filters built in. Free download on MQL5 — no purchase required.

    Price Action Patterns Pro — Free MT5 Indicator

    23 patterns · ATR + Volume filters · Push alerts to mobile · Auto-scaling arrows

    Download Free on MQL5 →

    Disclaimer: Candlestick patterns are technical analysis tools, not predictive signals. Always apply additional confluence and risk management before trading.
  • Spread, Slippage, and Commission: The 3% That Quietly Eats Your Edge

    Education · Trading Costs · 9 min read

    A trader runs a backtest on their strategy. Win rate 55%, average winner +1.5R, average loser -1R. The math says expectancy is +0.4R per trade — solid edge. They go live, run 200 trades over six months, and discover their real expectancy is closer to +0.05R per trade. The strategy did not change. The market did not change. So what happened?

    The 35-basis-point per trade gap between backtest and reality is almost always one thing: trading costs that the backtest ignored or modeled wrong. Spread, slippage, and commission compound across every entry and every exit. Over 200 trades, even small per-trade costs eat huge chunks of edge.

    Most retail traders treat costs as a small detail and obsess over entry signals. The math says they have it backwards: a 1-pip improvement in execution typically helps the equity curve more than a 5% improvement in win rate.

    The Core Insight

    Trading costs are paid on every trade, win or lose. They do not respect your edge or your discipline — they show up the same regardless of whether the trade was a perfect setup or a bad impulse. Over a year of trading, costs are usually the second-largest determinant of your equity curve, right after position sizing.

    The Three Cost Components

    Every retail trade has three separate costs that combine into total transaction expense. Most traders look at one and ignore the other two — which is why their backtests do not match live results.

    1. Spread

    The gap between bid and ask price. Every trade you open immediately starts in negative territory by exactly the spread amount, because you bought at the ask and you can only sell at the bid (or the opposite for shorts). Spread is usually quoted in pips: a 1-pip spread on EURUSD means every trade starts -1 pip down before any market movement.

    Spread is not constant. It widens during low-liquidity hours (Asian session for European pairs), during news releases, and on Sunday open. Typical patterns:

    TYPICAL SPREAD RANGES (RETAIL BROKERS)

    EURUSD London/NY : 0.5 – 1.2 pips

    EURUSD Asian : 1.5 – 2.5 pips

    EURUSD news : 3 – 8 pips (briefly)

    XAUUSD active : 20 – 40 cents

    XAUUSD news : $1 – $5 (briefly)

    2. Slippage

    The difference between the price you wanted and the price you actually got. On stop loss orders especially, slippage can be brutal — your stop is supposed to fire at 1.0850, but the broker fills you at 1.0843 because price gapped through the level on a news spike. That extra 7 pips is pure slippage cost.

    Slippage shows up in two flavors. Negative slippage happens when the price moves against you between order submission and execution — this is the typical case. Positive slippage (price improves) is mathematically possible but rare on retail accounts. The asymmetry means slippage almost always costs you money over time, not the other way around.

    3. Commission

    Direct fee per trade, charged separately from spread. ECN brokers charge low commission (typically $3-7 per round-trip per standard lot) but offer raw spreads near zero. Standard accounts have no commission but wider spreads. The total cost is usually similar — the structure just differs.

    A common trap: traders see “no commission” and assume they are saving money. Often they are paying the same total cost or more, just packaged into spread. The right comparison is total cost per round-trip, not commission alone.

    The Compounding Problem

    Here is what most traders miss: each trade pays the full round-trip cost regardless of outcome. A trade that wins +10 pips with 1-pip spread is really +9 pips of edge. A trade that loses -10 pips with 1-pip spread is really -11 pips of damage. The cost is symmetric on every trade; the edge is not.

    Run this through a high-frequency scalping strategy with average winner +8 pips and 1-pip total transaction cost:

    SCALPING STRATEGY — 200 TRADES

    Backtest expectancy (no costs) : +1.5 pips/trade

    After 1 pip transaction cost : +0.5 pips/trade

    200 trades, no costs : +300 pips

    200 trades, with costs : +100 pips (-67%)

    The strategy “still works” — but two-thirds of the profit went to the broker, not the trader. This is why scalping strategies that look great in backtests often disappoint in live trading: the small edge per trade becomes negligible after transaction costs eat their share.

    Compare to a swing trading strategy with average winner +60 pips and the same 1-pip transaction cost:

    SWING STRATEGY — 50 TRADES

    Backtest expectancy (no costs) : +12 pips/trade

    After 1 pip transaction cost : +11 pips/trade

    50 trades, no costs : +600 pips

    50 trades, with costs : +550 pips (-8%)

    Same 1-pip cost, completely different impact on the equity curve. Lower-frequency, larger-target strategies are cost-resilient. Higher-frequency, smaller-target strategies are cost-fragile. This single fact explains why most retail scalping strategies fail in live trading even when their logic is correct.

    The Hidden Cost — Spread on Stop Loss

    Stop loss orders pay spread implicitly through the bid-ask gap. A long position with a stop at 1.0830 actually fires when the bid hits 1.0830 — which means the ask is around 1.0831. You exit at the bid; you bought at the ask. The 1-pip spread cost is baked into the round-trip whether you notice it or not.

    This matters when you set stops too tight relative to spread. A “10-pip stop” with 2-pip spread is really an 8-pip stop in terms of price movement to trigger — which is a 20% increase in stop-out frequency compared to your intended risk. And critically, this connects directly to lot sizing: as covered in Position Sizing 101, your real risk per trade depends on the actual stop distance, which includes spread.

    For very tight stops on volatile instruments, the spread cost can dominate. A 5-pip stop on EURUSD during a news release with 4-pip spread means you have only 1 pip of actual room before the spread alone closes the trade. The trade is already 80% dead before any market movement.

    When Slippage Becomes Catastrophic

    Spread is predictable. Slippage during normal conditions is small. Slippage during specific events can be account-killing.

    News Spike Slippage

    During major news (NFP, FOMC, CPI), price can gap multiple pips in a single tick. If your stop is in the gap, you do not get the price you set — you get the next available price after the spike. A 10-pip stop on EURUSD during NFP might fill 25-30 pips below your level, turning a 1% risk trade into 2.5-3% loss event.

    Weekend Gap Slippage

    Forex closes Friday and reopens Sunday. If meaningful news breaks over the weekend, the open price may be far from Friday’s close. Your stop is supposed to fire at 1.0850, but EURUSD opens Sunday at 1.0780 — your stop fills 70 pips below intended. This is the same gap risk discussed for breakeven decisions in Breakeven Stops: When to Move, When to Wait — closing positions or moving to breakeven before weekend close avoids the worst of this risk.

    Black Swan Events

    SNB unpegging the franc in 2015, the Brexit vote, the COVID flash crash — when markets gap in ways nobody priced in, slippage can be measured in figures you cannot survive. A 30-pip stop becoming 800-pip slippage. Most retail accounts that blew up during these events did not lose because their analysis was wrong; they lost because slippage exceeded their stop by 20x.

    Practical Defense

    For tail-risk slippage events, the only defense is smaller position size on positions held through scheduled high-impact news or weekends. If your normal trade risks 1%, the same trade through NFP should be sized at 0.3-0.5% to absorb 2-3x slippage and still be a manageable loss.

    The True Cost Calculation

    To know your real expectancy, calculate true cost per round-trip:

    True cost = avg spread + avg slippage + commission per lot

    For a typical EURUSD trade on a standard retail account, that math looks like:

    Avg spread (London/NY) : 1.0 pip

    Avg slippage (per side) : 0.3 pip

    Round-trip slippage : 0.6 pip

    Commission (per lot) : 0 pips equivalent

    True cost per round-trip: ~1.6 pips

    If your strategy’s average winner is 8 pips, your real edge per winner is 6.4 pips after costs — 20% lower than the backtest. If your strategy’s average winner is 50 pips, the real edge per winner is 48.4 pips — 3% lower than the backtest. Same true cost, very different impact.

    Practical Cost Reduction

    Once you understand the math, the levers for reducing costs are clear:

    • Trade liquid sessions only. EURUSD spread during London/NY overlap is 1/3 of Asian session spread. If your strategy works on majors, restricting trading to 13:00-21:00 UTC cuts spread costs by half or more.
    • Avoid scheduled news for entries. Spread widens 5-10x during high-impact releases. Unless you specifically trade news as your edge, opening positions in the 10 minutes before/after major releases is paying significantly more in spread for no reason.
    • Set max-spread filters. Refuse to take trades when current spread exceeds a threshold (e.g., 3x the pair’s normal spread). This automatically blocks news-period entries and Asian-session-on-European-pair traps.
    • Match instrument volatility to stop distance. A 5-pip stop on a pair with 2-pip spread is structurally bad. Either widen stops to give spread room, or trade tighter-spread instruments at that scale.
    • Compare brokers honestly. A “no commission” broker with 1.8-pip spread is more expensive than a commission broker with 0.4-pip spread plus $5 round-trip. Math the total cost, not the headline.

    Tools That Make Cost Tracking Automatic

    Tracking spread in real time, blocking entries when spread exceeds threshold, and adjusting position sizing for current cost conditions — these are all things humans theoretically can do but practically never do consistently. By the time you have checked the spread on the spec sheet, calculated whether it is acceptable, and decided whether to take the trade, the setup has moved.

    A trading platform that displays current spread in real time, refuses to take trades above a max-spread threshold, and accounts for spread in lot size calculations removes the manual tracking step entirely. Costs become a structural part of the trade decision rather than an afterthought.

    RiskFlow Pro shows live spread in points on the dashboard and includes a max-spread filter that blocks new trade entries when current spread exceeds your configured limit. Combined with the multi-symbol monitor, you can see at a glance which instruments are currently tradable and which are in their high-cost period. The lot size calculator also accounts for spread in your stop distance, ensuring your risk math stays accurate even when costs spike.

    For the spread filter setup and how it interacts with the daily drawdown protection during volatile sessions, the Quick Start guide walks through the basic configuration, while the Advanced Features guide covers the deeper integration with session filtering and the four risk modes.

    Key Takeaways

    • Trading costs are paid every trade — they compound across hundreds of trades into the second-largest determinant of equity curve.
    • Three cost components: spread (bid-ask gap), slippage (price difference at execution), commission (direct fee).
    • Costs hit scalping strategies disproportionately — same 1-pip cost cuts a scalper’s edge by 60%+ but a swing trader’s by less than 5%.
    • Tail-risk slippage during news, weekend gaps, and black swans can exceed your stop by 10-20x — only defense is smaller size for events.
    • True cost = avg spread + avg slippage (round-trip) + commission. Calculate it for your typical conditions.
    • Practical reductions: trade liquid sessions, avoid news entries, set max-spread filters, match stops to spread, compare brokers on total cost.

    Get RiskFlow Pro

    Live spread tracking. Max-spread filter. Cost-aware sizing.

    Stop letting transaction costs quietly eat your edge. Free MT5 dashboard, any broker, any instrument.

    Download Free on MQL5 →

    For setup walkthrough, read the Quick Start Guide.

  • Multi-Symbol Correlation Risk: Why Your 4 Independent Trades Aren’t Independent

    Education · Risk Management · 9 min read

    A trader opens four positions. They spent good time on each chart, each setup is technically sound, and each trade risks 1% of the account. Total exposure: 4%. Manageable. Right?

    Almost never. The four positions are usually not four independent bets — they are often the same bet expressed four different ways. When the market moves against the underlying theme, all four hit stops simultaneously, and the trader who thought they were risking 4% has actually lost 8%, 12%, or more.

    This is correlation risk, and it is the silent killer of traders who otherwise have decent risk management on individual trades. The math is brutal because it hides — every individual position looks safe right up until they all break together.

    The Core Insight

    Per-trade risk is not real risk. Real risk is the sum of all correlated exposures during a stress event. A 1% trade in EURUSD plus a 1% trade in GBPUSD plus a 1% trade in AUDUSD is not three 1% trades — it is one 3% bet that the dollar weakens, and it will hit 3% of drawdown together when it goes wrong.

    What Correlation Actually Means in Trading

    Correlation is a number between -1 and +1 that measures how two instruments move together. Values close to +1 mean they move in the same direction almost always. Values close to -1 mean they move in opposite directions. Zero means independent.

    Most retail traders treat correlation as an academic concept and ignore it in practice. This works fine until the day a major news event or risk-off move forces every correlated position to act as one — and then it is too late.

    TYPICAL FOREX CORRELATIONS (DAILY, ROUGH AVERAGES)

    EURUSD vs GBPUSD : +0.85 (very high)

    EURUSD vs AUDUSD : +0.70 (high)

    EURUSD vs USDCHF : -0.95 (mirror image)

    XAUUSD vs USD index : -0.75 (gold inverse to dollar)

    SPX vs NDX : +0.92 (essentially the same bet)

    The numbers shift over time, especially during regime changes — pairs that were +0.5 last year might be +0.85 this year. But the rough hierarchy is stable: major Forex pairs tend to move together against the dollar, indices move together as a “risk-on/risk-off” basket, and metals move inversely to the dollar.

    The Hidden Bet Problem

    Here is the trap that catches almost every multi-pair trader at least once: thinking you are diversified when you are concentrated.

    A trader sees four “different” setups — long EURUSD, long GBPUSD, long AUDUSD, short USDJPY. Each chart has its own structure, its own entry trigger, its own stop. The trader feels diversified because they are in four different pairs. But look at what those four positions have in common: they are all short the dollar. The technical setups are independent. The macro bet is identical.

    When the dollar rallies on a hot CPI print or hawkish Fed statement, all four positions move against the trader at the same time. The four “1% trades” become a single 4% loss event — and that is best case, because correlated stops typically all fire within minutes of each other, often with widening spreads making each fill worse than the calculated risk.

    WHAT THE TRADER THINKS vs WHAT THEY HAVE

    Stated risk : 4 x 1% = 4% total exposure

    Actual exposure : ~3.5% to single dollar move

    Stress event : -3.5% to -5% in one event

    The Three Correlation Clusters Every Trader Should Know

    You do not need to memorize a correlation matrix. You need to recognize the three clusters that catch retail traders most often.

    1. The Dollar Cluster

    EURUSD, GBPUSD, AUDUSD, NZDUSD all trade against the dollar as the second currency. When the dollar moves, all four move together (inversely). Adding USDJPY, USDCHF, USDCAD as shorts gives you the same exposure from the other side. A multi-Forex portfolio is almost always a leveraged bet on the dollar direction — the technical reasons for each individual trade are noise compared to that single macro factor.

    2. The Risk-On Cluster

    Equity indices (SPX, NDX, DAX), high-beta currencies (AUDUSD, NZDUSD, EURUSD on most days), and crypto all tend to rally together during “risk-on” sessions and fall together during “risk-off” panic. A long position in stocks plus a long position in AUDUSD plus a long position in BTCUSD is essentially three expressions of the same “risk appetite is healthy” thesis. They will all be wrong on the same day.

    3. The Inflation/Commodity Cluster

    Gold, oil, silver, and to a lesser extent copper and the AUD all tend to move together during inflation regime shifts. They are not perfectly correlated day-to-day, but during major inflation surprise events (CPI prints, OPEC announcements), they often spike or crash as a group. Long Gold plus long Oil plus long AUDUSD during a CPI release is a single inflation bet, not three diversified positions.

    The Quick Test

    Before opening a new position, ask: “If the dollar rallies hard right now, do all my open positions go red?” If yes, the new trade is not diversifying — it is doubling down.

    The Math of Correlated Risk

    Risk does not add linearly when positions are correlated. The proper way to think about it is the effective concurrent risk, which depends on the correlation coefficient.

    For two positions of equal size with correlation r, the combined stress-event loss is approximately:

    Combined risk = base risk x (1 + r) for positively correlated pairs

    Two 1% trades on EURUSD and GBPUSD (correlation +0.85) carry combined stress risk of about 1.85% — almost double the “diversified” math. Add a third correlated position and the combined risk approaches 3x the per-trade risk. The intuition that “more pairs equals more diversification” is exactly backwards inside a correlation cluster.

    FOUR 1% POSITIONS — EFFECTIVE RISK

    All independent (r=0) : ~2% effective

    All in one cluster (r=0.7) : ~3.5% effective

    All in same direction (r=0.9) : ~3.9% effective

    The “all independent” case is the academic ideal. In practice, retail traders who use technical setups across major Forex are almost always closer to the r=0.7 case — which means their stated 4% risk is really 3.5% concentrated risk, with much higher chance of all hitting stops together.

    The Practical Rules

    There are three simple rules that handle 95% of correlation risk without requiring you to calculate matrices in real time.

    Rule 1: Set a Cluster Cap

    Decide in advance the maximum exposure per cluster. A reasonable rule: no more than 2% combined risk in any single cluster. If you already have 1% in EURUSD long, you can add 1% in GBPUSD long — but that uses your full dollar-cluster budget. Adding AUDUSD long after that breaks the rule, even though “each trade is only 1%.”

    Rule 2: Half-Size Within Clusters

    If you are determined to take multiple correlated positions, halve the position size on each beyond the first. First trade: full 1% risk. Second trade in same cluster: 0.5%. Third: 0.25%. This keeps total cluster exposure under control while still letting you express conviction across multiple setups.

    Rule 3: Calendar-Aware Exposure

    Correlations spike during scheduled events. The day of NFP, FOMC, or major CPI prints, every dollar pair becomes essentially perfectly correlated for a 30-minute window. Either close correlated positions before high-impact news or accept that your effective risk during that window is roughly the sum of all positions, not the diversified estimate.

    Common Trap

    Believing that holding both long EURUSD and short USDCHF “hedges” because they are inversely correlated. This is mathematically wrong — those two positions are essentially the same bet on EUR strength, just with different cost structures. Hedging requires negatively correlated positions in the same direction, not opposite directions in inversely correlated instruments.

    The Account-Level View

    The fundamental shift that fixes correlation risk is changing how you think about position sizing. Instead of asking “what is the risk per trade?”, start asking “what is my total exposure if a single major event hits?”

    This connects directly to the position-sizing fundamentals covered in Position Sizing 101 — the per-trade math is necessary but not sufficient. Once you have correct per-trade sizing, the next layer is making sure the per-trade math does not compound across correlated positions.

    It is also the reason most blown accounts fail in ways the trader never expected, as discussed in Why Retail Traders Blow Accounts. The trader had “1% risk per trade” written in their journal. They were following it. They still hit -8% in a single news event because the four positions all moved together. The rule was right; the level of analysis was wrong.

    Tools That Make Cluster Tracking Automatic

    Tracking correlation exposure manually requires you to maintain a mental cluster map for every open position, recalculate on every entry, and adjust position sizes accordingly. In live trading, this almost never gets done correctly — markets move fast and the mental math gets dropped.

    A multi-symbol monitor that shows total open positions, accumulated risk by symbol group, and current spread/exposure across the whole portfolio removes the manual tracking step entirely. Instead of trying to remember “do I have too much dollar exposure?”, the answer is on the screen at all times.

    RiskFlow Pro includes a multi-symbol monitor floating window that shows every open position with live P&L, total risk, and the current spread state across symbols. Combined with the daily drawdown protection, you get a portfolio-level view of risk that catches correlation issues before they become 8% loss events.

    For the multi-symbol monitor walkthrough, the four risk modes that handle different exposure profiles, and how the daily limit interacts with concurrent positions, the Advanced Features guide walks through each tool in detail with worked examples.

    Key Takeaways

    • Per-trade risk is not real risk. Real risk is concurrent exposure during a stress event.
    • Three correlation clusters catch most retail traders: dollar pairs, risk-on instruments, inflation/commodity baskets.
    • Two correlated 1% trades carry roughly 1.85% combined stress risk, not 2%.
    • Set a cluster cap (2% combined max), half-size within clusters, and respect calendar-driven correlation spikes.
    • Inverse correlations are not hedges — long EURUSD plus short USDCHF is the same bet, not a hedge.
    • Use a multi-symbol monitor — manual cluster tracking always breaks down in live trading.

    Get RiskFlow Pro

    See your real exposure, not just per-trade risk.

    Multi-symbol monitor, total risk tracking, daily drawdown protection. Free MT5 dashboard, any broker, any instrument.

    Download Free on MQL5 →

    For the multi-symbol monitor walkthrough, read the Advanced Features Guide.
  • Position Sizing 101: The Math Behind Every Trade

    Position Sizing 101: The Math Behind Every Trade

    Education · Risk Management · 10 min read

    Most traders who blow up their accounts do not lose because their strategy is bad. They lose because their position sizes are wrong. One trade too big, one stop too wide, one missed calculation on a non-standard instrument — and months of gains disappear in an afternoon.

    The good news: position sizing is math, not magic. Once you understand the formula and the three numbers that feed it, you can size any trade on any instrument correctly, every single time. This guide walks through it from first principles.

    What You Will Learn

    The one formula that works for every instrument, how to calculate each input, why gold and indices break naive lot calculators, and how to get the math right in under 5 seconds per trade.

    The Universal Position Sizing Formula

    Every correct lot size calculation reduces to a single equation. No matter what you trade — Forex, gold, oil, indices, crypto — the formula does not change:

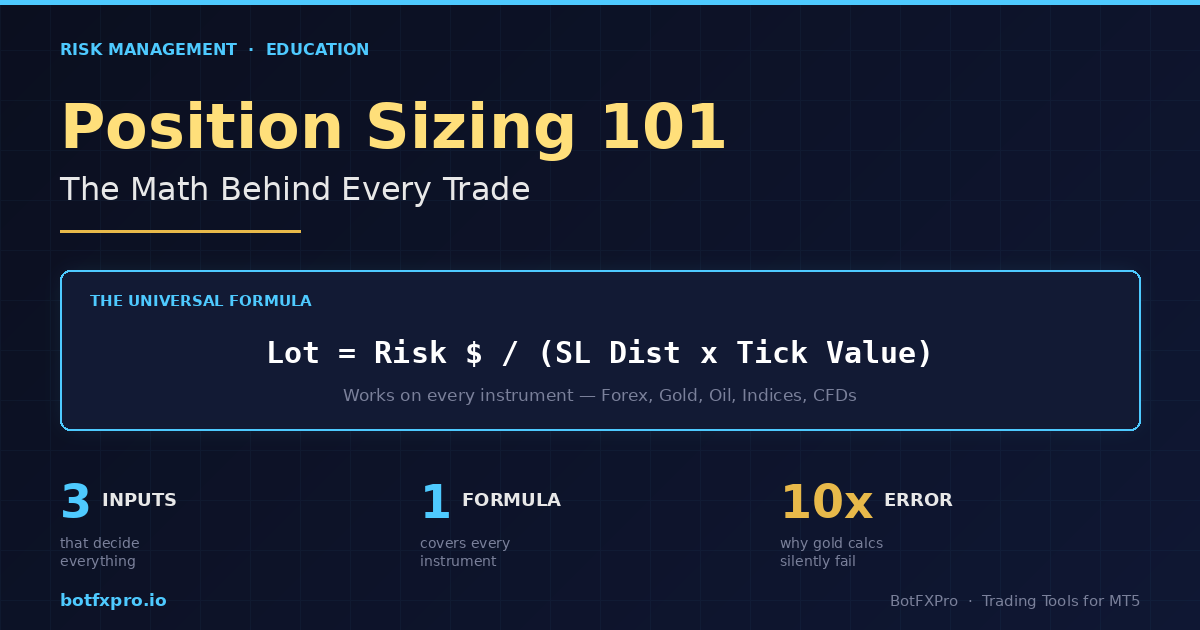
    Lot Size = Risk $ ÷ (SL Distance × Value Per Point Per Lot)

    Three inputs. That is it. If you know how many dollars you are willing to lose on this trade, how far your stop loss sits from your entry, and how much money each point of price movement costs you on one lot — you have the answer.

    The reason traders mess this up is not the formula. It is getting those three inputs right, especially the third one. Let us break each of them down.

    Input 1 — Your Risk Amount in Dollars

    This is the easiest one. Pick your risk percentage, multiply by your account balance.

    If your balance is $10,000 and you risk 1% per trade, your risk amount is $100. That is the maximum dollar loss you will accept if this trade hits your stop loss.

    How much should the percentage be? Most professional traders and prop firm rules sit somewhere between 0.5% and 2% per trade. Below that and winners barely move your account. Above that and a normal losing streak wipes you out.

    Quick Reference

    A string of 5 consecutive losses at 1% risk drops your account 4.9%. The same 5 losses at 5% risk drops it 22.6%. This is why small percentages matter.

    Input 2 — Stop Loss Distance

    This is the distance between your entry price and your stop loss price, measured in the instrument’s smallest unit of movement. On EURUSD, that unit is typically a pip. On XAUUSD (gold), it is usually $0.01 or $0.10 depending on broker. On US30, it is 1 index point.

    The critical thing: your stop loss distance is determined by your chart analysis, not by what lot size you want to trade. If the correct technical stop is 50 pips away, that is your stop — you do not tighten it to 10 pips just to trade bigger. Tight arbitrary stops are a direct path to account death.

    Worked example on EURUSD:

    • Entry: 1.0850
    • Stop loss: 1.0820 (just below a swing low)
    • Distance: 30 pips

    Input 3 — Value Per Point Per Lot (The One People Get Wrong)

    This is where naive lot calculators — and a lot of traders — go completely off the rails. The value per point depends on the instrument, and it is not the same across your watchlist.

    For standard Forex pairs, the math is familiar:

    • 1 standard lot = 100,000 units of the base currency
    • On EURUSD, 1 pip on 1 standard lot ≈ $10
    • On GBPUSD, same — ≈ $10 per pip per standard lot
    • On USDJPY, close to $10 but varies with the USDJPY rate itself

    Plug those numbers into our formula with the EURUSD example:

    Risk $: $100

    SL distance: 30 pips

    Value per pip per lot: $10

    Lot = 100 ÷ (30 × 10) = 0.33 lots

    So a correct 1%-risk trade on a 30-pip stop at $10,000 balance is 0.33 lots. Not 1 lot. Not 0.1 lots. The math is precise.

    Why Gold, Indices, and Oil Break Naive Calculators

    This is the part that trips up traders — and where most free online lot calculators fail silently.

    On XAUUSD (gold), a “pip” is not well-defined. Different brokers quote gold with 2, 3, or even 4 decimal places. The contract size also varies — some brokers use 100 oz per lot, others use 10 oz. If you assume $10 per “pip” like on EURUSD, your risk calculation could be off by 10x.

    On US30 or NAS100 CFDs, one index point might be worth $1 per lot on one broker and $0.10 on another. Oil (Brent, WTI) is similar — contract sizes and tick values are broker-specific.

    The fix: stop thinking in pips for these instruments. Use Tick Size and Tick Value — two values your broker publishes for every instrument, and that MT5 exposes directly:

    • Tick Size — the smallest price increment (e.g. 0.01 for gold, 1.0 for US30)
    • Tick Value — the dollar value of one tick on one standard lot (e.g. $1 on gold at 100 oz lot size)

    The universal formula rewritten in these terms:

    Lot = Risk $ ÷ ((SL distance ÷ Tick Size) × Tick Value)

    This works for everything. Gold, oil, crypto CFDs, DXY, US30, Bitcoin — every instrument has a published Tick Size and Tick Value, so you just plug them in.

    Common Mistake

    Using a “gold pip calculator” from a website that assumes $1 per pip per mini lot. On a broker that uses 10-oz contracts with 2-decimal pricing, this can under-size your position by 10x — meaning your “1% risk” trade is actually risking 0.1%. The opposite error (over-sizing by 10x) blows accounts in a single trade.

    Worked Example on Gold

    Suppose your broker quotes XAUUSD with 2 decimal places (tick size 0.01), 100-oz contracts, and a tick value of $1 per tick per standard lot. You want to buy gold at 2650.00 with a stop at 2645.00 — a 5-dollar move, which is 500 ticks.

    Balance: $10,000 · Risk 1% → Risk $ = $100

    SL distance: 5.00 ÷ 0.01 = 500 ticks

    Tick value per lot: $1

    Lot = 100 ÷ (500 × 1) = 0.20 lots

    0.20 lots of gold at a 500-tick stop risks exactly $100. Every time.

    Sanity Checks Every Trader Should Run

    Before you click BUY or SELL, run these three quick checks:

    1. Is the risk dollar amount right? If your 1% risk shows as $1,000 when your account is $10k, something is off by 10x.
    2. Is the margin required reasonable? A calculated lot that requires more margin than your free margin means the position will be rejected — you need to either lower risk % or take a tighter stop.
    3. Does the lot round to the broker’s minimum step? If the formula says 0.347 lots but the broker only accepts 0.01 increments, round down to 0.34 — never up.

    The Shortcut — Automate the Math

    Doing this calculation by hand before every trade is slow and error-prone. When markets move fast, you skip the math — and that is exactly when wrong lot sizes get entered.

    The solution is to let MT5 itself handle the calculation. Every instrument in MT5 exposes its Tick Size and Tick Value through the broker’s symbol specification, so a well-written EA can read those values directly and output the correct lot size in real time — no guesswork, no broker-specific table lookups, no pip-vs-tick confusion.

    This is exactly what RiskFlow Pro does. You enter your risk %, your entry, and your stop — it reads the instrument’s real Tick Size and Tick Value from your broker and gives you the correct lot size instantly. Works on Forex, gold, oil, indices, crypto CFDs, whatever your broker offers.

    If you are new to the tool, the Quick Start guide walks you from download to your first properly-sized trade in under 5 minutes. It is free on MQL5 and works on any broker account.

    Practical Tip

    Even if you use an automated calculator, do the manual math on paper for the first 5 trades of any new instrument. This builds intuition for what “correct” looks like and helps you spot calculator errors before they hurt you.

    Key Takeaways

    • Position size is math, not opinion. One formula covers every instrument.
    • For Forex pairs, pip value thinking works. For gold, indices, oil, and CFDs, use Tick Size and Tick Value instead.
    • Your stop distance comes from chart analysis, not from what lot size feels good. Size the position to fit the stop — never the reverse.
    • Automating the math removes the single most common cause of retail blowups: wrong lot size on non-standard instruments.

    Get RiskFlow Pro

    Stop calculating lot size by hand.

    Free MT5 dashboard that does the math for you — on any instrument, any broker.

    Download Free on MQL5 →

    Or read the Quick Start Guide first — you will be trading properly-sized positions in under 5 minutes.

  • Chronos Algo vs Forex Fury (2026): A Straightforward Comparison for Serious Traders

    Chronos Algo vs Forex Fury (2026): A Straightforward Comparison for Serious Traders

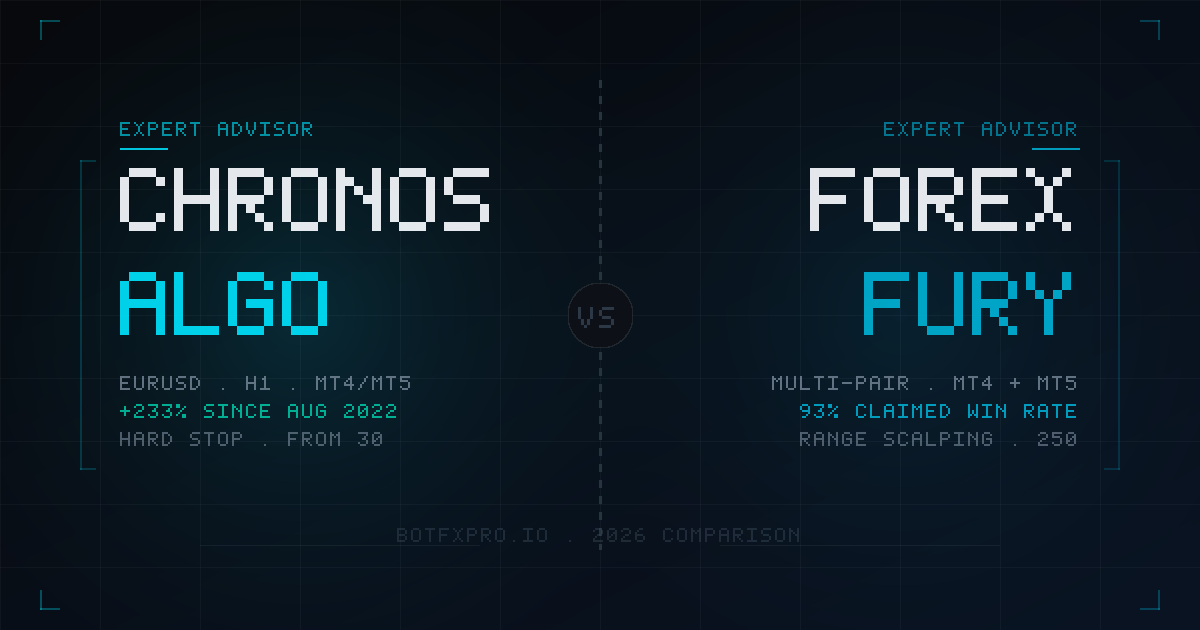
    Chronos Algo and Forex Fury are both long-running Expert Advisors with verified live accounts, real user bases, and genuine track records. They are also fundamentally different in how they trade, how they manage risk, and what kind of trader each one suits.

    This comparison covers both EAs honestly — including the risks of each. The goal is to give you the information to make a decision that fits your account size, risk tolerance, and trading goals.


    At a Glance

    Chronos Algo

    • EURUSD · H1 · MT4 + MT5
    • Martingale basket strategy
    • Hard portfolio stop at -65%
    • 3+ years live · Myfxbook verified
    • +233% gain since Aug 2022
    • From $30 · lifetime license

    Forex Fury

    • Multi-pair · MT4 + MT5
    • Range scalping strategy
    • Optional martingale feature
    • Multi-year live · Myfxbook verified
    • 93% claimed win rate
    • $250 · lifetime license


    Strategy: How Each EA Actually Trades

    Chronos Algo — Martingale Basket on EURUSD H1

    Chronos Algo trades EURUSD on the 1-hour chart using a multi-indicator entry filter that requires agreement across Stochastic, ADX, MACD, RSI, CCI, ATR, and Envelopes before opening a position. This deliberate filtering reduces how often the EA enters the market, which limits the frequency of recovery sequences.

    When the market moves against the initial position, the EA opens additional positions in the same direction with progressively larger lot sizes — a martingale basket. Exit logic is tiered: small baskets close at a profit target; larger baskets shift to breakeven exit, closing all positions the moment equity recovers to entry level. This prevents deep sequences from requiring a large profit recovery before closing.

    A hard portfolio stop loss at -65% closes all open positions automatically if account drawdown reaches that threshold. Individual trades carry no per-trade stop — the system manages positions as a basket. The -65% floor defines the absolute worst-case outcome.

    What this means for your account

    On a $1,000 account, the absolute worst-case single loss is $650 — if the -65% hard stop triggers. In practice, the maximum recorded drawdown on the live account is -32.90%, meaning this floor has not been approached in 3+ years of real trading.

    This is also consistent with the backtest record. Across 11 years of backtesting (2013–2024) using 100% real tick data with the same default settings used on the live account, the maximum equity drawdown reached 32.40% — and the -65% portfolio stop was never triggered across the entire period. The close alignment between backtest drawdown (~32%) and live drawdown (~33%) suggests the strategy behaves as expected in real market conditions. Minimum recommended capital is $1,000.

    Forex Fury — Range Scalping During Low-Volatility Windows

    Forex Fury targets brief periods of low market volatility — typically around 4–5 PM EST — and trades within defined price ranges, aiming for small, consistent 5-pip take profits. This narrow targeting approach produces a high win rate (claimed 93%, independently cited as ~91%) by avoiding the volatility of major sessions and news events.

    The EA trades one currency pair per account. Default settings do not attach a stop loss to individual trades. An optional martingale feature is available, which increases lot size after a loss to accelerate recovery — but this can be disabled by the user. Risk settings (low / medium / high) adjust position sizing and exposure.

    What This Means for Your Account

    The high win rate provides strong protection in stable, ranging conditions. In trending or high-volatility markets, the absence of a per-trade stop loss means losing positions can remain open for extended periods. Managing risk settings carefully — and understanding how the martingale option affects exposure — is important before running this EA live.


    Risk Structure: Side by Side

    Factor Chronos Algo Forex Fury
    Core strategy Martingale basket · trend-following Range scalping · low-volatility sessions
    Martingale Yes — core strategy, fully disclosed Optional feature · off by default
    Per-trade stop loss No — basket managed as unit No — by default; configurable
    Portfolio hard stop Yes — closes all at -65% drawdown No published hard stop
    Win rate 77.51% (backtest) · live varies 93% claimed · ~91% independently cited
    Trade frequency Low — multi-indicator filter limits entries Daily — trades ~1 hour per day
    Pairs traded EURUSD only Multiple pairs (one per account)
    Platforms MT4 + MT5 MT4 + MT5
    Prop firm compatible Generally no — martingale restricted Varies — some settings may qualify

    Live Track Records

    Chronos Algo

    Cumulative gain
    +233%
    Since Aug 2022 · MT4 live

    Max drawdown
    32.90%
    Live recorded · hard floor -65%

    Verified withdrawals
    $1,273
    Verified on MQL5

    Live since
    2022
    3+ years continuous

    Chronos Algo has MT4 and MT5 live accounts, both independently tracked on Myfxbook. Verified withdrawals of $1,273.25 on MQL5 confirm that real profits were extracted from the account — not just reflected in an equity curve. The account has run continuously since August 2022 without restart. The backtest covers 2013–2026 with 99.9% tick data, showing a profit factor of 1.99.

    Forex Fury

    Forex Fury has published Myfxbook-verified accounts since 2015 with a claimed 93% win rate and gains exceeding 200% on select accounts. The EA has a large user base of 21,600+ clients. Live results are verifiable on Myfxbook. Performance varies based on broker, settings, and market conditions — as with all EAs, individual results may differ from the published accounts.


    Pricing

    Chronos Algo
    From $30
    Lifetime · per account

    Forex Fury
    $250
    Lifetime · single license

    Chronos Algo is priced per account with a lifetime license. Forex Fury is priced at $250 for a single account license with lifetime updates. For traders running multiple accounts, per-account pricing makes a meaningful difference in total cost.


    Which EA Fits Which Trader?

    You want a defined worst-case loss before you buy Chronos Algo — the -65% hard stop defines the maximum outcome
    You prefer a high win rate with frequent small gains Forex Fury — 91–93% win rate with daily trade activity
    You’re running multiple accounts Chronos Algo — per-account pricing from $30 scales better
    You want to trade multiple currency pairs Forex Fury — supports multiple pairs across separate accounts
    You value a long, uninterrupted live track record Both — each has multi-year verified live history
    You’re starting with limited capital ($100–$500) Forex Fury — lower minimum capital requirement
    You want to verify real withdrawals from the live account Chronos Algo — $1,273.25 in verified MQL5 withdrawals
    A note on prop firm trading

    Both EAs use strategies that may conflict with prop firm rules. Martingale-based systems (Chronos Algo) are generally prohibited by most funded account programs. Forex Fury may qualify with certain settings, but check your firm’s specific rules before using either EA on a challenge or funded account.


    Summary

    Chronos Algo and Forex Fury are built for different trading philosophies. Forex Fury is designed around high-frequency, low-risk-per-trade scalping that wins consistently in calm conditions. Chronos Algo is a trend-following martingale system that trades less frequently but captures larger moves — with a hard portfolio stop that defines the absolute downside.

    Neither EA is right for everyone. The choice comes down to what kind of risk you prefer to manage: the frequency risk of a scalper that needs stable conditions, or the drawdown risk of a martingale system with a defined floor.

    Both have verifiable live track records. Both have been running for multiple years. Both carry real risk — as all leveraged trading systems do. Whichever you choose, understanding the risk structure before you deploy capital is the most important step.

    See Chronos Algo’s Full Live Track Record

    3+ years live. Verified withdrawals on MQL5. Hard portfolio stop at -65%. From $30 lifetime.

    View Chronos Algo →

    Risk Disclosure: Chronos Algo is a Martingale-based system. It can open multiple positions with progressively larger lot sizes during adverse market conditions. A hard portfolio stop loss at -65% is enforced, but this stop can still be triggered in extreme market conditions — resulting in a loss of up to 65% of your account balance. Forex trading involves substantial risk of loss and is not suitable for all investors. Past performance is not indicative of future results. Never trade with money you cannot afford to lose. Always test on a demo account before deploying live. Minimum recommended capital: $1,000. Information on Forex Fury is sourced from publicly available materials and independent reviews; BotFXPro makes no claims regarding its performance or suitability.

  • Why Most Forex EAs Fail(And How to Find One That Doesn’t)

    Why Most Forex EAs Fail(And How to Find One That Doesn’t)

    The statistics on forex EA failure are not encouraging. Most automated trading systems stop working within 12–18 months of release. Many blow accounts within weeks of going live.

    But some systems run for years, generate real profits, and survive multiple market cycles.

    The difference usually comes down to one thing: how losses are handled.


    The Core Problem: Manufacturing a Good Track Record

    The easiest way to build a forex robot with an impressive-looking track record is to remove the stop loss.

    Without a stop loss, a losing trade is never closed. Instead, it sits open — accumulating loss — while the equity curve shows a smooth upward line from closed trades. When you look at the stats, all you see are the winning positions.

    This approach has many names: martingale, grid trading, averaging down, hedging with correlated positions. The mechanics differ, but the principle is the same: losses are hidden, not managed.

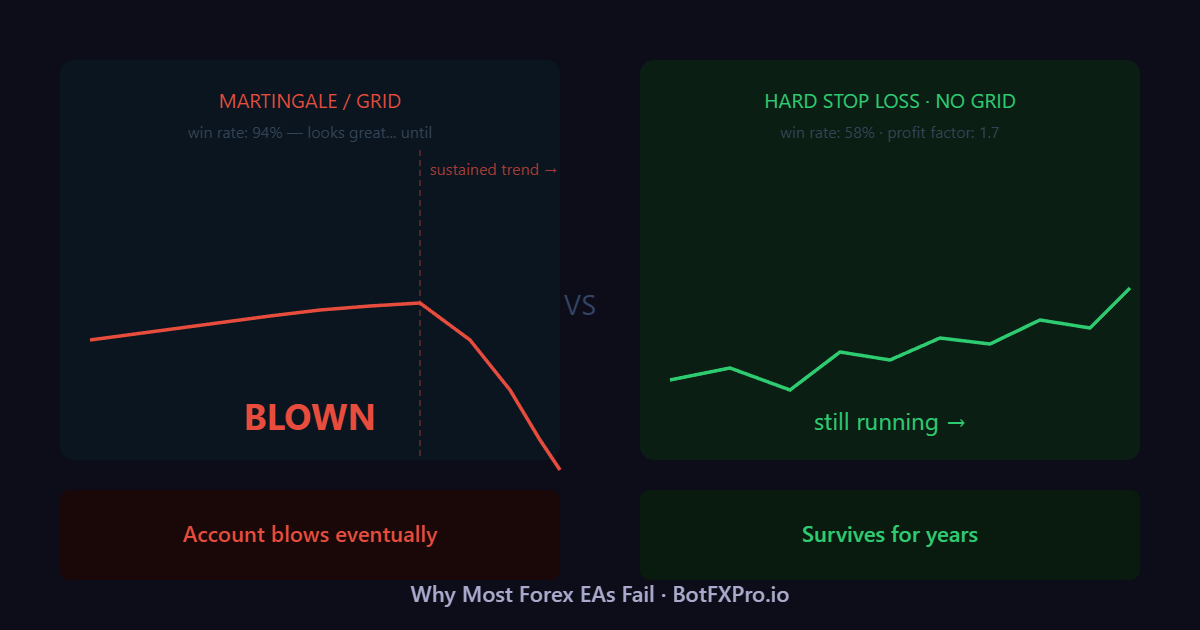
    It works until it doesn’t. A sustained trend against the open positions triggers a margin call, and the account is gone.


    Why Martingale Feels Safe (Until It Isn’t)

    Martingale strategies add to losing positions. If you’re down on a trade, you open another in the same direction with a larger size. If the market reverses, the combined position closes at breakeven or better.

    In a ranging market, this can work for a long time. Win rates above 90% are common because most small reversals get recovered before closing at a loss.

    The problem is that trend markets — especially in currency pairs or gold — can move in one direction for weeks. At that point, martingale systems don’t recover. They compound the loss with each new addition until the account is exhausted.

    The win rate looks great right up until the account blows.


    What “No Martingale, No Grid” Actually Means

    A forex EA that uses no martingale and no grid has a fundamentally different risk profile:

    • Every trade has a hard stop loss — if the trade goes wrong, the loss is fixed and finite
    • Position sizing is independent per trade — a loss on one trade doesn’t affect the size of the next
    • Drawdown is bounded — the worst case is a series of losses at the defined risk per trade, not an exponential blowup

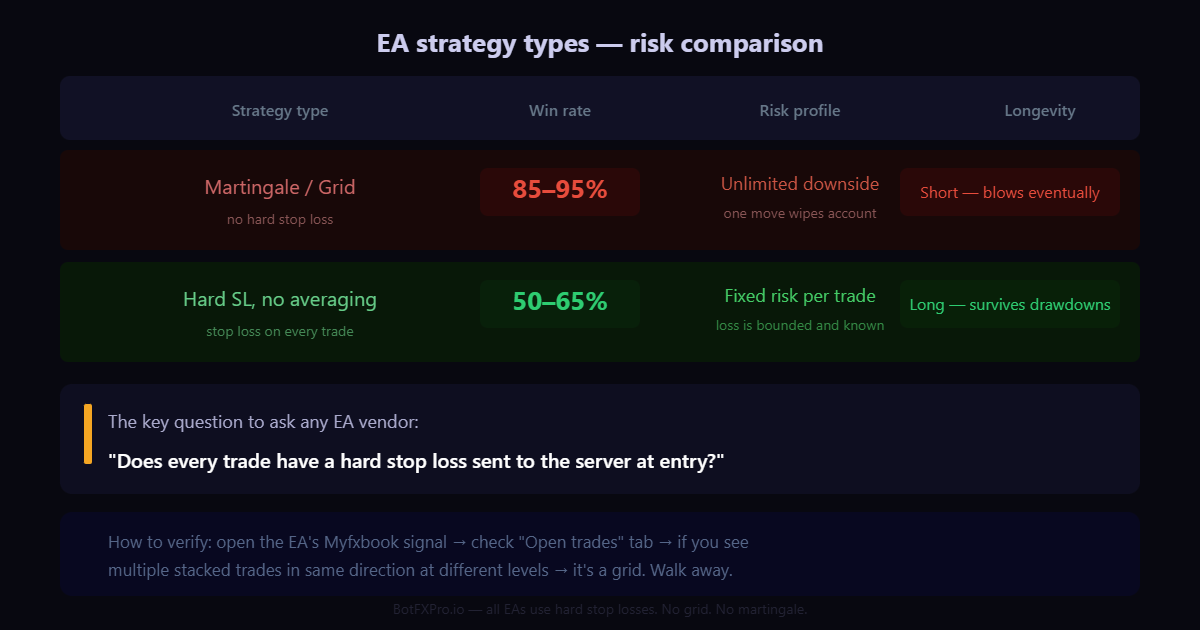
    The tradeoff is that win rates tend to be lower — typically 50–65% rather than 85–95%. But a 60% win rate with a 1.5:1 reward/risk ratio is sustainably profitable. A 95% win rate with unlimited downside is not.


    How to Verify a System’s Risk Approach

    Before purchasing any EA, check these specific things:

    1. Check the open trades section on Myfxbook

    If the live signal shows multiple open trades stacked in the same direction at different price levels, it’s a grid or averaging system — regardless of what the marketing says.

    2. Look at the maximum drawdown

    A martingale system will show a very low drawdown until it blows. But if you look at the floating drawdown on open trades, you’ll often see large unrealized losses.

    3. Ask directly

    Email the vendor and ask: “Does every trade have a hard stop loss sent to the server at the time of entry?” A legitimate vendor will say yes. An evasive answer is a red flag.

    4. Check the trade history

    Download the full trade history from Myfxbook and look for the stop loss value on every trade. If it’s blank or zero, the system has no hard stop.


    The Long-Term Advantage of Hard Stop Losses

    Systems that use hard stop losses have one major structural advantage: they survive.

    A martingale system that runs for 2 years might look better than a hard-stop system over the same period. But the martingale system carries the risk of a single catastrophic event that destroys everything. The hard-stop system takes smaller, defined losses and continues operating.

    Over a 5–10 year horizon, the compounding effect of a consistently profitable, risk-managed system significantly outperforms a high-win-rate system that blows once every few years.

    This is why institutional traders don’t use martingale. Position limits, risk per trade, and hard stops are standard practice — not because they maximize short-term performance, but because they preserve capital for the long run.


    EA strategy types — risk comparison

    What to Look For

    Strategy TypeWin RateRisk ProfileLongevity
    Martingale / Grid85–95%Unbounded lossShort (blows eventually)
    Hard SL, no averaging50–65%Fixed risk per tradeLong (survives drawdowns)

    When you find an EA with a multi-year live track record, hard stop losses on every trade, and no grid or martingale — that’s the rare system worth your attention.


    Looking for an EA with hard stop losses, no grid, and no martingale on every trade? The Gold Trend Accelerator Combo runs 7 independent strategies on XAUUSD — each with a hard SL, zero averaging, and zero grid logic. Learn more →