Tag: Gold Trading

  • +29% in One Month: What 3 Months of Patience Actually Taught Us

    +29% in One Month: What 3 Months of Patience Actually Taught Us

    February 2026 came and went with almost nothing to show for it. -0.01%.

    March 2026 produced a small loss. -3.78%.

    If you had started running this EA in January and watched those two months pass, you might have started wondering — is it still working? Should I stop it? Did I choose the wrong system?

    April 2026 answered that question.

    April 2026
    +29%
    SINGLE MONTH
    3-Month Total
    +32.28%
    ABSOLUTE GAIN
    Max Drawdown
    16.81%
    ENTIRE PERIOD
    Live Profit
    $645.55
    FROM $2,000

    Every figure above is tracked and verified by a third-party platform connected directly to the live account. The account started with a $2,000 deposit in late January 2026 on a micro account.

    Why two “bad” months are not a warning sign

    Gold Trend Accelerator Combo runs seven independent systems simultaneously on a single XAUUSD chart. They split into two families:

    T-Systems (T1–T4) — Direct Trend
    Enter in the direction of the EMA crossover signal. Designed to capture sustained momentum in gold. Each system operates on its own timeframe — M30, H1, or H4 — with independently tuned EMA periods and ATR-based Stop Loss distances.
    R-Systems (R1–R3) — Counter Trend
    Enter opposite the EMA signal. Designed to profit from mean reversion. They perform well when gold overextends, reverses, or consolidates without breaking out cleanly.

    In February and March, gold moved without sustained direction. T-systems caught partial momentum moves but gave back gains when trends failed to extend. R-systems partially offset those losses — but the consolidation was not clean enough for strong reversal entries either.

    This is not system failure. This is the system waiting — absorbing an adverse period with contained drawdown rather than catastrophic loss.

    The monthly breakdown

    January
    +8.97%
    February
    -0.01%
    March
    -3.78%
    April ★
    +29%

    What April 2026 actually demonstrates

    April saw sustained directional movement in gold. The T-systems fired consistently into those conditions:

    • T3 on H1 — fixed TP structure locked in profits at predefined ATR-based targets as each momentum wave completed
    • T1 on M30 — trailing stop extended gains as intraday trends stretched further than expected
    • T4 on H4 — positioned into the larger structural move on the higher timeframe

    The R-systems were quieter in April — fewer counter-trend entries triggered. This is correct behaviour. In a trending market, the counter-trend systems reduce activity. Their silence in April is not underperformance — it is discipline.

    The result: +29% in a single month — not from excessive risk, but from T-systems firing efficiently into the conditions they were designed for.

    Three lessons from these three months

    Lesson 1 — Monthly results are the wrong lens
    February at -0.01% tells you nothing meaningful about system quality. It tells you the market was not cooperative that month. A good system survives the bad months and profits in the good ones — it does not profit every single month.
    Lesson 2 — Controlled drawdown is a feature, not a flaw
    -3.78% in March sounds unpleasant. Compare that to a martingale or grid EA in the same conditions — a bad month can mean -30% or a blown account. A system with a hard Stop Loss on every trade absorbs difficult months without destroying the account.
    Lesson 3 — Patience has a dollar value
    Anyone who stopped the EA in March missed +29% in April. One decision made from short-term anxiety can erase months of compounding in an instant. The system design only works if you give it time to work.

    How the system works — overview

    • Entry: EMA crossover, individually tuned per system and timeframe (M30, H1, H4)
    • Stop Loss & Take Profit: ATR-based — adjusts automatically to real market volatility
    • Trailing Stop: Selective — T1, T2, R3 use trailing stops; T3, T4, R1, R2 use fixed TP
    • Position sizing: One position per system max; lot size = % of account balance based on SL distance
    • Installation: Single XAUUSD chart — all 7 systems and 3 timeframes managed internally

    No grid. No martingale. Every trade carries a hard Stop Loss sent to the broker server at entry.

    Who this system is — and is not — designed for

    If you are looking for an EA that produces consistent gains every single month, this is probably not the right fit. Gold Trend Accelerator Combo is designed for traders who understand that real alpha often arrives in batches, who can accept a small controlled drawdown during unfavourable periods, and who think in multi-month terms.

    If you want a system with no grid, no martingale, a hard Stop Loss on every trade, multi-timeframe coverage from a single chart, and a verified live track record — this is worth a serious look.

    View Gold Trend Accelerator Combo →

    Past performance is not indicative of future results. Trading involves risk. Always test on a demo account before going live.

  • Multi-Symbol Correlation Risk: Why Your 4 Independent Trades Aren’t Independent

    Education · Risk Management · 9 min read

    A trader opens four positions. They spent good time on each chart, each setup is technically sound, and each trade risks 1% of the account. Total exposure: 4%. Manageable. Right?

    Almost never. The four positions are usually not four independent bets — they are often the same bet expressed four different ways. When the market moves against the underlying theme, all four hit stops simultaneously, and the trader who thought they were risking 4% has actually lost 8%, 12%, or more.

    This is correlation risk, and it is the silent killer of traders who otherwise have decent risk management on individual trades. The math is brutal because it hides — every individual position looks safe right up until they all break together.

    The Core Insight

    Per-trade risk is not real risk. Real risk is the sum of all correlated exposures during a stress event. A 1% trade in EURUSD plus a 1% trade in GBPUSD plus a 1% trade in AUDUSD is not three 1% trades — it is one 3% bet that the dollar weakens, and it will hit 3% of drawdown together when it goes wrong.

    What Correlation Actually Means in Trading

    Correlation is a number between -1 and +1 that measures how two instruments move together. Values close to +1 mean they move in the same direction almost always. Values close to -1 mean they move in opposite directions. Zero means independent.

    Most retail traders treat correlation as an academic concept and ignore it in practice. This works fine until the day a major news event or risk-off move forces every correlated position to act as one — and then it is too late.

    TYPICAL FOREX CORRELATIONS (DAILY, ROUGH AVERAGES)

    EURUSD vs GBPUSD : +0.85 (very high)

    EURUSD vs AUDUSD : +0.70 (high)

    EURUSD vs USDCHF : -0.95 (mirror image)

    XAUUSD vs USD index : -0.75 (gold inverse to dollar)

    SPX vs NDX : +0.92 (essentially the same bet)

    The numbers shift over time, especially during regime changes — pairs that were +0.5 last year might be +0.85 this year. But the rough hierarchy is stable: major Forex pairs tend to move together against the dollar, indices move together as a “risk-on/risk-off” basket, and metals move inversely to the dollar.

    The Hidden Bet Problem

    Here is the trap that catches almost every multi-pair trader at least once: thinking you are diversified when you are concentrated.

    A trader sees four “different” setups — long EURUSD, long GBPUSD, long AUDUSD, short USDJPY. Each chart has its own structure, its own entry trigger, its own stop. The trader feels diversified because they are in four different pairs. But look at what those four positions have in common: they are all short the dollar. The technical setups are independent. The macro bet is identical.

    When the dollar rallies on a hot CPI print or hawkish Fed statement, all four positions move against the trader at the same time. The four “1% trades” become a single 4% loss event — and that is best case, because correlated stops typically all fire within minutes of each other, often with widening spreads making each fill worse than the calculated risk.

    WHAT THE TRADER THINKS vs WHAT THEY HAVE

    Stated risk : 4 x 1% = 4% total exposure

    Actual exposure : ~3.5% to single dollar move

    Stress event : -3.5% to -5% in one event

    The Three Correlation Clusters Every Trader Should Know

    You do not need to memorize a correlation matrix. You need to recognize the three clusters that catch retail traders most often.

    1. The Dollar Cluster

    EURUSD, GBPUSD, AUDUSD, NZDUSD all trade against the dollar as the second currency. When the dollar moves, all four move together (inversely). Adding USDJPY, USDCHF, USDCAD as shorts gives you the same exposure from the other side. A multi-Forex portfolio is almost always a leveraged bet on the dollar direction — the technical reasons for each individual trade are noise compared to that single macro factor.

    2. The Risk-On Cluster

    Equity indices (SPX, NDX, DAX), high-beta currencies (AUDUSD, NZDUSD, EURUSD on most days), and crypto all tend to rally together during “risk-on” sessions and fall together during “risk-off” panic. A long position in stocks plus a long position in AUDUSD plus a long position in BTCUSD is essentially three expressions of the same “risk appetite is healthy” thesis. They will all be wrong on the same day.

    3. The Inflation/Commodity Cluster

    Gold, oil, silver, and to a lesser extent copper and the AUD all tend to move together during inflation regime shifts. They are not perfectly correlated day-to-day, but during major inflation surprise events (CPI prints, OPEC announcements), they often spike or crash as a group. Long Gold plus long Oil plus long AUDUSD during a CPI release is a single inflation bet, not three diversified positions.

    The Quick Test

    Before opening a new position, ask: “If the dollar rallies hard right now, do all my open positions go red?” If yes, the new trade is not diversifying — it is doubling down.

    The Math of Correlated Risk

    Risk does not add linearly when positions are correlated. The proper way to think about it is the effective concurrent risk, which depends on the correlation coefficient.

    For two positions of equal size with correlation r, the combined stress-event loss is approximately:

    Combined risk = base risk x (1 + r) for positively correlated pairs

    Two 1% trades on EURUSD and GBPUSD (correlation +0.85) carry combined stress risk of about 1.85% — almost double the “diversified” math. Add a third correlated position and the combined risk approaches 3x the per-trade risk. The intuition that “more pairs equals more diversification” is exactly backwards inside a correlation cluster.

    FOUR 1% POSITIONS — EFFECTIVE RISK

    All independent (r=0) : ~2% effective

    All in one cluster (r=0.7) : ~3.5% effective

    All in same direction (r=0.9) : ~3.9% effective

    The “all independent” case is the academic ideal. In practice, retail traders who use technical setups across major Forex are almost always closer to the r=0.7 case — which means their stated 4% risk is really 3.5% concentrated risk, with much higher chance of all hitting stops together.

    The Practical Rules

    There are three simple rules that handle 95% of correlation risk without requiring you to calculate matrices in real time.

    Rule 1: Set a Cluster Cap

    Decide in advance the maximum exposure per cluster. A reasonable rule: no more than 2% combined risk in any single cluster. If you already have 1% in EURUSD long, you can add 1% in GBPUSD long — but that uses your full dollar-cluster budget. Adding AUDUSD long after that breaks the rule, even though “each trade is only 1%.”

    Rule 2: Half-Size Within Clusters

    If you are determined to take multiple correlated positions, halve the position size on each beyond the first. First trade: full 1% risk. Second trade in same cluster: 0.5%. Third: 0.25%. This keeps total cluster exposure under control while still letting you express conviction across multiple setups.

    Rule 3: Calendar-Aware Exposure

    Correlations spike during scheduled events. The day of NFP, FOMC, or major CPI prints, every dollar pair becomes essentially perfectly correlated for a 30-minute window. Either close correlated positions before high-impact news or accept that your effective risk during that window is roughly the sum of all positions, not the diversified estimate.

    Common Trap

    Believing that holding both long EURUSD and short USDCHF “hedges” because they are inversely correlated. This is mathematically wrong — those two positions are essentially the same bet on EUR strength, just with different cost structures. Hedging requires negatively correlated positions in the same direction, not opposite directions in inversely correlated instruments.

    The Account-Level View

    The fundamental shift that fixes correlation risk is changing how you think about position sizing. Instead of asking “what is the risk per trade?”, start asking “what is my total exposure if a single major event hits?”

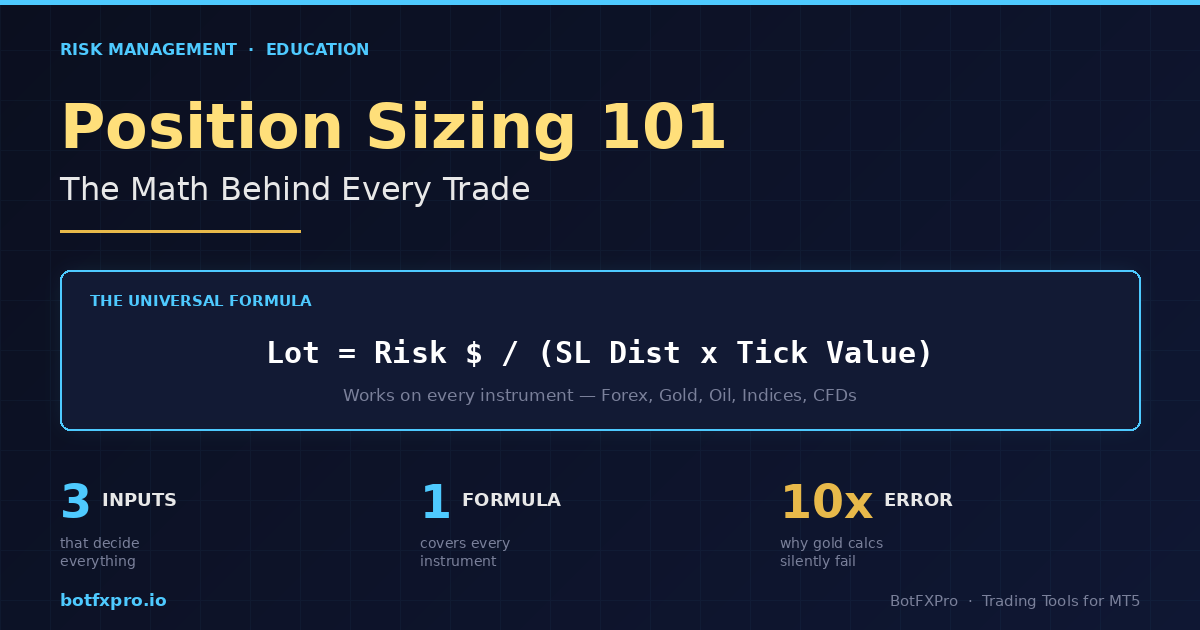
    This connects directly to the position-sizing fundamentals covered in Position Sizing 101 — the per-trade math is necessary but not sufficient. Once you have correct per-trade sizing, the next layer is making sure the per-trade math does not compound across correlated positions.

    It is also the reason most blown accounts fail in ways the trader never expected, as discussed in Why Retail Traders Blow Accounts. The trader had “1% risk per trade” written in their journal. They were following it. They still hit -8% in a single news event because the four positions all moved together. The rule was right; the level of analysis was wrong.

    Tools That Make Cluster Tracking Automatic

    Tracking correlation exposure manually requires you to maintain a mental cluster map for every open position, recalculate on every entry, and adjust position sizes accordingly. In live trading, this almost never gets done correctly — markets move fast and the mental math gets dropped.

    A multi-symbol monitor that shows total open positions, accumulated risk by symbol group, and current spread/exposure across the whole portfolio removes the manual tracking step entirely. Instead of trying to remember “do I have too much dollar exposure?”, the answer is on the screen at all times.

    RiskFlow Pro includes a multi-symbol monitor floating window that shows every open position with live P&L, total risk, and the current spread state across symbols. Combined with the daily drawdown protection, you get a portfolio-level view of risk that catches correlation issues before they become 8% loss events.

    For the multi-symbol monitor walkthrough, the four risk modes that handle different exposure profiles, and how the daily limit interacts with concurrent positions, the Advanced Features guide walks through each tool in detail with worked examples.

    Key Takeaways

    • Per-trade risk is not real risk. Real risk is concurrent exposure during a stress event.
    • Three correlation clusters catch most retail traders: dollar pairs, risk-on instruments, inflation/commodity baskets.
    • Two correlated 1% trades carry roughly 1.85% combined stress risk, not 2%.
    • Set a cluster cap (2% combined max), half-size within clusters, and respect calendar-driven correlation spikes.
    • Inverse correlations are not hedges — long EURUSD plus short USDCHF is the same bet, not a hedge.
    • Use a multi-symbol monitor — manual cluster tracking always breaks down in live trading.

    Get RiskFlow Pro

    See your real exposure, not just per-trade risk.

    Multi-symbol monitor, total risk tracking, daily drawdown protection. Free MT5 dashboard, any broker, any instrument.

    Download Free on MQL5 →

    For the multi-symbol monitor walkthrough, read the Advanced Features Guide.

  • Position Sizing 101: The Math Behind Every Trade

    Position Sizing 101: The Math Behind Every Trade

    Education · Risk Management · 10 min read

    Most traders who blow up their accounts do not lose because their strategy is bad. They lose because their position sizes are wrong. One trade too big, one stop too wide, one missed calculation on a non-standard instrument — and months of gains disappear in an afternoon.

    The good news: position sizing is math, not magic. Once you understand the formula and the three numbers that feed it, you can size any trade on any instrument correctly, every single time. This guide walks through it from first principles.

    What You Will Learn

    The one formula that works for every instrument, how to calculate each input, why gold and indices break naive lot calculators, and how to get the math right in under 5 seconds per trade.

    The Universal Position Sizing Formula

    Every correct lot size calculation reduces to a single equation. No matter what you trade — Forex, gold, oil, indices, crypto — the formula does not change:

    Lot Size = Risk $ ÷ (SL Distance × Value Per Point Per Lot)

    Three inputs. That is it. If you know how many dollars you are willing to lose on this trade, how far your stop loss sits from your entry, and how much money each point of price movement costs you on one lot — you have the answer.

    The reason traders mess this up is not the formula. It is getting those three inputs right, especially the third one. Let us break each of them down.

    Input 1 — Your Risk Amount in Dollars

    This is the easiest one. Pick your risk percentage, multiply by your account balance.

    If your balance is $10,000 and you risk 1% per trade, your risk amount is $100. That is the maximum dollar loss you will accept if this trade hits your stop loss.

    How much should the percentage be? Most professional traders and prop firm rules sit somewhere between 0.5% and 2% per trade. Below that and winners barely move your account. Above that and a normal losing streak wipes you out.

    Quick Reference

    A string of 5 consecutive losses at 1% risk drops your account 4.9%. The same 5 losses at 5% risk drops it 22.6%. This is why small percentages matter.

    Input 2 — Stop Loss Distance

    This is the distance between your entry price and your stop loss price, measured in the instrument’s smallest unit of movement. On EURUSD, that unit is typically a pip. On XAUUSD (gold), it is usually $0.01 or $0.10 depending on broker. On US30, it is 1 index point.

    The critical thing: your stop loss distance is determined by your chart analysis, not by what lot size you want to trade. If the correct technical stop is 50 pips away, that is your stop — you do not tighten it to 10 pips just to trade bigger. Tight arbitrary stops are a direct path to account death.

    Worked example on EURUSD:

    • Entry: 1.0850
    • Stop loss: 1.0820 (just below a swing low)
    • Distance: 30 pips

    Input 3 — Value Per Point Per Lot (The One People Get Wrong)

    This is where naive lot calculators — and a lot of traders — go completely off the rails. The value per point depends on the instrument, and it is not the same across your watchlist.

    For standard Forex pairs, the math is familiar:

    • 1 standard lot = 100,000 units of the base currency
    • On EURUSD, 1 pip on 1 standard lot ≈ $10
    • On GBPUSD, same — ≈ $10 per pip per standard lot
    • On USDJPY, close to $10 but varies with the USDJPY rate itself

    Plug those numbers into our formula with the EURUSD example:

    Risk $: $100

    SL distance: 30 pips

    Value per pip per lot: $10

    Lot = 100 ÷ (30 × 10) = 0.33 lots

    So a correct 1%-risk trade on a 30-pip stop at $10,000 balance is 0.33 lots. Not 1 lot. Not 0.1 lots. The math is precise.

    Why Gold, Indices, and Oil Break Naive Calculators

    This is the part that trips up traders — and where most free online lot calculators fail silently.

    On XAUUSD (gold), a “pip” is not well-defined. Different brokers quote gold with 2, 3, or even 4 decimal places. The contract size also varies — some brokers use 100 oz per lot, others use 10 oz. If you assume $10 per “pip” like on EURUSD, your risk calculation could be off by 10x.

    On US30 or NAS100 CFDs, one index point might be worth $1 per lot on one broker and $0.10 on another. Oil (Brent, WTI) is similar — contract sizes and tick values are broker-specific.

    The fix: stop thinking in pips for these instruments. Use Tick Size and Tick Value — two values your broker publishes for every instrument, and that MT5 exposes directly:

    • Tick Size — the smallest price increment (e.g. 0.01 for gold, 1.0 for US30)
    • Tick Value — the dollar value of one tick on one standard lot (e.g. $1 on gold at 100 oz lot size)

    The universal formula rewritten in these terms:

    Lot = Risk $ ÷ ((SL distance ÷ Tick Size) × Tick Value)

    This works for everything. Gold, oil, crypto CFDs, DXY, US30, Bitcoin — every instrument has a published Tick Size and Tick Value, so you just plug them in.

    Common Mistake

    Using a “gold pip calculator” from a website that assumes $1 per pip per mini lot. On a broker that uses 10-oz contracts with 2-decimal pricing, this can under-size your position by 10x — meaning your “1% risk” trade is actually risking 0.1%. The opposite error (over-sizing by 10x) blows accounts in a single trade.

    Worked Example on Gold

    Suppose your broker quotes XAUUSD with 2 decimal places (tick size 0.01), 100-oz contracts, and a tick value of $1 per tick per standard lot. You want to buy gold at 2650.00 with a stop at 2645.00 — a 5-dollar move, which is 500 ticks.

    Balance: $10,000 · Risk 1% → Risk $ = $100

    SL distance: 5.00 ÷ 0.01 = 500 ticks

    Tick value per lot: $1

    Lot = 100 ÷ (500 × 1) = 0.20 lots

    0.20 lots of gold at a 500-tick stop risks exactly $100. Every time.

    Sanity Checks Every Trader Should Run

    Before you click BUY or SELL, run these three quick checks:

    1. Is the risk dollar amount right? If your 1% risk shows as $1,000 when your account is $10k, something is off by 10x.
    2. Is the margin required reasonable? A calculated lot that requires more margin than your free margin means the position will be rejected — you need to either lower risk % or take a tighter stop.
    3. Does the lot round to the broker’s minimum step? If the formula says 0.347 lots but the broker only accepts 0.01 increments, round down to 0.34 — never up.

    The Shortcut — Automate the Math

    Doing this calculation by hand before every trade is slow and error-prone. When markets move fast, you skip the math — and that is exactly when wrong lot sizes get entered.

    The solution is to let MT5 itself handle the calculation. Every instrument in MT5 exposes its Tick Size and Tick Value through the broker’s symbol specification, so a well-written EA can read those values directly and output the correct lot size in real time — no guesswork, no broker-specific table lookups, no pip-vs-tick confusion.

    This is exactly what RiskFlow Pro does. You enter your risk %, your entry, and your stop — it reads the instrument’s real Tick Size and Tick Value from your broker and gives you the correct lot size instantly. Works on Forex, gold, oil, indices, crypto CFDs, whatever your broker offers.

    If you are new to the tool, the Quick Start guide walks you from download to your first properly-sized trade in under 5 minutes. It is free on MQL5 and works on any broker account.

    Practical Tip

    Even if you use an automated calculator, do the manual math on paper for the first 5 trades of any new instrument. This builds intuition for what “correct” looks like and helps you spot calculator errors before they hurt you.

    Key Takeaways

    • Position size is math, not opinion. One formula covers every instrument.
    • For Forex pairs, pip value thinking works. For gold, indices, oil, and CFDs, use Tick Size and Tick Value instead.
    • Your stop distance comes from chart analysis, not from what lot size feels good. Size the position to fit the stop — never the reverse.
    • Automating the math removes the single most common cause of retail blowups: wrong lot size on non-standard instruments.

    Get RiskFlow Pro

    Stop calculating lot size by hand.

    Free MT5 dashboard that does the math for you — on any instrument, any broker.

    Download Free on MQL5 →

    Or read the Quick Start Guide first — you will be trading properly-sized positions in under 5 minutes.