Tag: Risk Management

  • Position Sizing 101: The Math Behind Every Trade

    Position Sizing 101: The Math Behind Every Trade

    Education · Risk Management · 10 min read

    Most traders who blow up their accounts do not lose because their strategy is bad. They lose because their position sizes are wrong. One trade too big, one stop too wide, one missed calculation on a non-standard instrument — and months of gains disappear in an afternoon.

    The good news: position sizing is math, not magic. Once you understand the formula and the three numbers that feed it, you can size any trade on any instrument correctly, every single time. This guide walks through it from first principles.

    What You Will Learn

    The one formula that works for every instrument, how to calculate each input, why gold and indices break naive lot calculators, and how to get the math right in under 5 seconds per trade.

    The Universal Position Sizing Formula

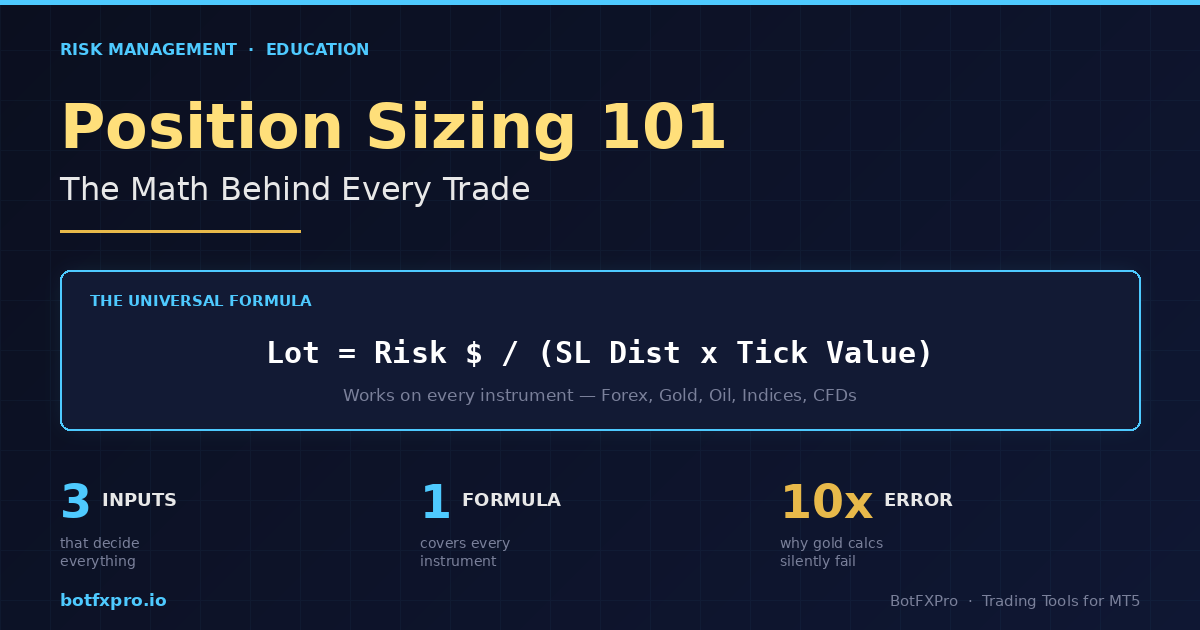
    Every correct lot size calculation reduces to a single equation. No matter what you trade — Forex, gold, oil, indices, crypto — the formula does not change:

    Lot Size = Risk $ ÷ (SL Distance × Value Per Point Per Lot)

    Three inputs. That is it. If you know how many dollars you are willing to lose on this trade, how far your stop loss sits from your entry, and how much money each point of price movement costs you on one lot — you have the answer.

    The reason traders mess this up is not the formula. It is getting those three inputs right, especially the third one. Let us break each of them down.

    Input 1 — Your Risk Amount in Dollars

    This is the easiest one. Pick your risk percentage, multiply by your account balance.

    If your balance is $10,000 and you risk 1% per trade, your risk amount is $100. That is the maximum dollar loss you will accept if this trade hits your stop loss.

    How much should the percentage be? Most professional traders and prop firm rules sit somewhere between 0.5% and 2% per trade. Below that and winners barely move your account. Above that and a normal losing streak wipes you out.

    Quick Reference

    A string of 5 consecutive losses at 1% risk drops your account 4.9%. The same 5 losses at 5% risk drops it 22.6%. This is why small percentages matter.

    Input 2 — Stop Loss Distance

    This is the distance between your entry price and your stop loss price, measured in the instrument’s smallest unit of movement. On EURUSD, that unit is typically a pip. On XAUUSD (gold), it is usually $0.01 or $0.10 depending on broker. On US30, it is 1 index point.

    The critical thing: your stop loss distance is determined by your chart analysis, not by what lot size you want to trade. If the correct technical stop is 50 pips away, that is your stop — you do not tighten it to 10 pips just to trade bigger. Tight arbitrary stops are a direct path to account death.

    Worked example on EURUSD:

    • Entry: 1.0850
    • Stop loss: 1.0820 (just below a swing low)
    • Distance: 30 pips

    Input 3 — Value Per Point Per Lot (The One People Get Wrong)

    This is where naive lot calculators — and a lot of traders — go completely off the rails. The value per point depends on the instrument, and it is not the same across your watchlist.

    For standard Forex pairs, the math is familiar:

    • 1 standard lot = 100,000 units of the base currency
    • On EURUSD, 1 pip on 1 standard lot ≈ $10
    • On GBPUSD, same — ≈ $10 per pip per standard lot
    • On USDJPY, close to $10 but varies with the USDJPY rate itself

    Plug those numbers into our formula with the EURUSD example:

    Risk $: $100

    SL distance: 30 pips

    Value per pip per lot: $10

    Lot = 100 ÷ (30 × 10) = 0.33 lots

    So a correct 1%-risk trade on a 30-pip stop at $10,000 balance is 0.33 lots. Not 1 lot. Not 0.1 lots. The math is precise.

    Why Gold, Indices, and Oil Break Naive Calculators

    This is the part that trips up traders — and where most free online lot calculators fail silently.

    On XAUUSD (gold), a “pip” is not well-defined. Different brokers quote gold with 2, 3, or even 4 decimal places. The contract size also varies — some brokers use 100 oz per lot, others use 10 oz. If you assume $10 per “pip” like on EURUSD, your risk calculation could be off by 10x.

    On US30 or NAS100 CFDs, one index point might be worth $1 per lot on one broker and $0.10 on another. Oil (Brent, WTI) is similar — contract sizes and tick values are broker-specific.

    The fix: stop thinking in pips for these instruments. Use Tick Size and Tick Value — two values your broker publishes for every instrument, and that MT5 exposes directly:

    • Tick Size — the smallest price increment (e.g. 0.01 for gold, 1.0 for US30)
    • Tick Value — the dollar value of one tick on one standard lot (e.g. $1 on gold at 100 oz lot size)

    The universal formula rewritten in these terms:

    Lot = Risk $ ÷ ((SL distance ÷ Tick Size) × Tick Value)

    This works for everything. Gold, oil, crypto CFDs, DXY, US30, Bitcoin — every instrument has a published Tick Size and Tick Value, so you just plug them in.

    Common Mistake

    Using a “gold pip calculator” from a website that assumes $1 per pip per mini lot. On a broker that uses 10-oz contracts with 2-decimal pricing, this can under-size your position by 10x — meaning your “1% risk” trade is actually risking 0.1%. The opposite error (over-sizing by 10x) blows accounts in a single trade.

    Worked Example on Gold

    Suppose your broker quotes XAUUSD with 2 decimal places (tick size 0.01), 100-oz contracts, and a tick value of $1 per tick per standard lot. You want to buy gold at 2650.00 with a stop at 2645.00 — a 5-dollar move, which is 500 ticks.

    Balance: $10,000 · Risk 1% → Risk $ = $100

    SL distance: 5.00 ÷ 0.01 = 500 ticks

    Tick value per lot: $1

    Lot = 100 ÷ (500 × 1) = 0.20 lots

    0.20 lots of gold at a 500-tick stop risks exactly $100. Every time.

    Sanity Checks Every Trader Should Run

    Before you click BUY or SELL, run these three quick checks:

    1. Is the risk dollar amount right? If your 1% risk shows as $1,000 when your account is $10k, something is off by 10x.
    2. Is the margin required reasonable? A calculated lot that requires more margin than your free margin means the position will be rejected — you need to either lower risk % or take a tighter stop.
    3. Does the lot round to the broker’s minimum step? If the formula says 0.347 lots but the broker only accepts 0.01 increments, round down to 0.34 — never up.

    The Shortcut — Automate the Math

    Doing this calculation by hand before every trade is slow and error-prone. When markets move fast, you skip the math — and that is exactly when wrong lot sizes get entered.

    The solution is to let MT5 itself handle the calculation. Every instrument in MT5 exposes its Tick Size and Tick Value through the broker’s symbol specification, so a well-written EA can read those values directly and output the correct lot size in real time — no guesswork, no broker-specific table lookups, no pip-vs-tick confusion.

    This is exactly what RiskFlow Pro does. You enter your risk %, your entry, and your stop — it reads the instrument’s real Tick Size and Tick Value from your broker and gives you the correct lot size instantly. Works on Forex, gold, oil, indices, crypto CFDs, whatever your broker offers.

    If you are new to the tool, the Quick Start guide walks you from download to your first properly-sized trade in under 5 minutes. It is free on MQL5 and works on any broker account.

    Practical Tip

    Even if you use an automated calculator, do the manual math on paper for the first 5 trades of any new instrument. This builds intuition for what “correct” looks like and helps you spot calculator errors before they hurt you.

    Key Takeaways

    • Position size is math, not opinion. One formula covers every instrument.
    • For Forex pairs, pip value thinking works. For gold, indices, oil, and CFDs, use Tick Size and Tick Value instead.
    • Your stop distance comes from chart analysis, not from what lot size feels good. Size the position to fit the stop — never the reverse.
    • Automating the math removes the single most common cause of retail blowups: wrong lot size on non-standard instruments.

    Get RiskFlow Pro

    Stop calculating lot size by hand.

    Free MT5 dashboard that does the math for you — on any instrument, any broker.

    Download Free on MQL5 →

    Or read the Quick Start Guide first — you will be trading properly-sized positions in under 5 minutes.
  • RiskFlow Pro Advanced Features: Every Tab Explained with Real Trading Examples

    RiskFlow Pro Advanced Features: Every Tab Explained with Real Trading Examples

    Advanced Guide · MT5 · Deep Dive · 15 min read

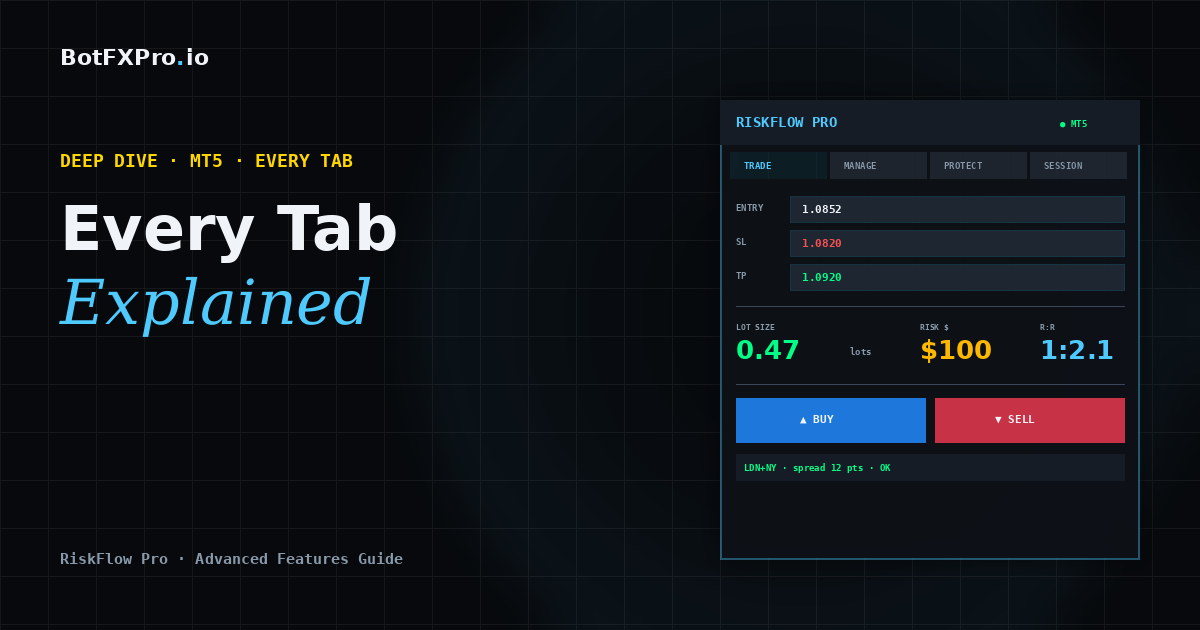
    You have RiskFlow Pro attached to your chart and you know how to size a trade and place it. Now you want to go deeper. This guide walks through every tab, every feature, and exactly when each one earns its keep in real trading.

    If you have not installed RiskFlow Pro yet or you are still getting your first trade placed, start with the Quick Start Guide first — it gets you from zero to your first trade in under 5 minutes, then come back here.

    What You Will Learn

    The four trailing stop modes, partial close triggers, split-entry strategies, OCO pending orders, virtual SL/TP stealth mode, the complete Protect tab for prop firm challenges, multi-symbol monitoring, hotkeys, and the trade journal. Everything with concrete examples you can copy.

    Manage Tab — The Heart of RiskFlow Pro

    This is where most of your edge comes from. The Manage tab turns you from a trader who places orders into a trader who systematically manages them.

    Breakeven — The One You Should Always Use

    You already know this one from the Quick Start guide. Toggle BE ON, set Trigger R to 1.0, set Offset pips to 2.0. That is 90% of traders sorted.

    Pro tip: for scalping (trades that last minutes), drop Trigger R to 0.5. For swing trades (trades that last days), bump it up to 1.5 to give the trade room to breathe before locking in.

    Partial Close — Bank Profit While Letting Winners Run

    The setup: Partial Close triggers at a specific R multiple and closes a percentage of your position. The field value is R multiples, not a percentage.

    Typical setup that works well for most strategies:

    • Close at R: 1.0 — closes at 1R profit
    • Close %: 50 — takes half off the table

    Pair this with Breakeven and something magical happens: when price hits 1R, you bank 50% profit AND your SL moves to entry. The remaining 50% of the position is now a risk-free runner heading toward your TP. This is the single highest-edge combo in retail trading.

    Trailing Stops — Four Modes, Know When to Use Which

    RiskFlow Pro offers four trailing methods. Cycle through them using the Trail Mode button.

    1. ATR Trailing — Uses Average True Range to set a dynamic distance from current price. Best for trending markets where volatility varies. Settings: Period 14, Multiplier 2.0-2.5. Tighter multipliers lock in faster but get stopped out on normal retracements.

    2. Pips Trailing — Fixed distance in pips. Best when you know the instrument’s typical retracement depth. For gold scalping, try 150250 pips. For EURUSD intraday, 2030 pips.

    3. Percent Trailing — Trails at a % distance from entry. Best for long-term holds where you want the stop to scale with the move.

    4. MA Trailing — Uses a moving average as the trailing stop line. Best for trend-following where you want to stay in as long as price is above/below MA. Cycle through period options: 20, 50, 100, 200.

    Common Mistake

    Do not enable Breakeven AND Trailing at the same time. They fight each other. Use Breakeven only, OR Trailing only. For most traders, Breakeven + Partial Close is the strongest combo.

    Split Entry — Distribute Risk Across Multiple Positions

    Set Split to 2 through 5. Your calculated lot size is divided across that many positions, all sharing the same SL and TP.

    Why bother? Two reasons. First, it lets you scale out at multiple TPs manually (close position 1 at 1R, position 2 at 2R, let position 3 run). Second, some brokers give better fills on smaller lot sizes. On prop firm accounts, this can also help with position size limits.

    Protect Tab — Prop Firm Lifesaver

    If you are running an FTMO challenge, MyForexFunds, The Funded Trader, or any other prop firm evaluation, this tab is what keeps you in the challenge instead of violating drawdown rules.

    Daily DD Limit

    Cycle through four DD calculation methods via the DD Type button:

    • FTMO Rel — FTMO’s relative method (balance at 00:00 CE(S)T). Use this for FTMO.
    • FTMO Abs — Absolute drawdown from starting balance.
    • % Balance — Generic percentage of current balance.
    • % Equity — Generic percentage of current equity.

    For FTMO specifically, enter 4.5 instead of exactly 5.0. That 0.5% buffer protects you from slippage, spread widening, and timing mismatches between your broker time and CE(S)T.

    Floor Line on Chart

    When Daily DD Limit is ON, RiskFlow Pro draws a horizontal line on your chart showing the exact equity level where your daily limit triggers. Psychologically, seeing this line is huge — it stops you from overtrading because you can see exactly how much room you have left.

    Max Spread & Slippage

    Two protection settings below the DD limit:

    • Max Spread — Blocks new orders when spread is above this value in points. Set to 30 for most majors, 50-100 for gold.
    • Max Slippage — Rejects orders that slip beyond this many points. Protects you during news events.

    Want push or email alerts when the daily DD limit triggers, a Partial Close fires, or your Stop Loss moves to breakeven? The MT5 notifications setup guide walks through the full configuration — push to your phone, email via SMTP, and which events are worth turning on.

    Pending Orders — OCO and Trailing Entries

    Place a pending order the usual way (entry price not at market), and RiskFlow Pro shows extra options.

    OCO (One Cancels the Other)

    Toggle OCO ON before placing two opposing pendings (e.g., Buy Stop above and Sell Stop below a range). When one triggers, the other is automatically cancelled. Perfect for breakout trading when you do not know direction but will trade the break either way.

    Pending Trailing

    Turns your pending order into a chase. As price moves in the direction of your pending entry, the pending order moves with it at a fixed distance. Useful when you want to catch a pullback entry but the price keeps trending. Set Trail Points to match typical retracement depth.

    Virtual SL/TP — Stealth Mode

    Toggle Virtual SL/TP ON. The SL and TP are tracked by the EA locally and sent as market orders when triggered, instead of sitting on the broker’s server. Benefits:

    • Brokers cannot see your stops (protects against stop hunting on some brokers)
    • Works around broker SL distance restrictions
    • Reduces “stop hunt” style false triggers from spike candles

    Important

    Virtual SL/TP only works while MT5 is running. If your VPS or MT5 terminal closes, there is no safety net. Use real SL/TP on your broker account as the master, and Virtual only as a secondary layer.

    Session Tab — Trade Only When Your Edge Exists

    Every instrument has hours when it moves and hours when it chops. Session filter blocks new trades outside your defined windows.

    The tab shows four preset sessions: Sydney, Tokyo, London, New York. You can customize each one’s open and close time in GMT. Toggle Session Filter ON and only the sessions you enable will allow new orders.

    Recommended filters by instrument:

    • Gold (XAUUSD): London + New York — the overlap (13:00-16:00 GMT) is the highest-edge window
    • EURUSD: London + NY open — avoid Asian session chop
    • USDJPY: Tokyo + London — avoid thin NY afternoon
    • US30 / Nasdaq: NY only — the indices barely move outside US hours

    Monitor — Track Positions Across All Charts

    Press the MON button (or hotkey M) to open the multi-symbol monitor window. You will see every open position RiskFlow Pro manages across all your charts — not just the current one.

    For each position: symbol, direction, lots, entry, current P&L, and time open. You can close any position directly from the Monitor without switching charts. If you trade 3-5 instruments simultaneously, this saves you serious clicking.

    Journal Tab — Your Trading History, Automated

    The Journal tab logs every trade RiskFlow Pro places: entry, exit, R multiple, duration, and your optional notes. No more manually tracking trades in a spreadsheet.

    Two things to do regularly:

    1. Export to CSV weekly. Click the Export button on the Journal tab. Open in Excel or Google Sheets and filter by R multiple. Your biggest insights come from seeing which setups actually hit 2R+ vs which ones chop around 0.5R.
    2. Add notes in the Trade tab before pressing BUY/SELL. Even a 3-word tag like “NY open pullback” gives you filterable categories for review later.

    Hotkeys — Trade Without Clicking

    Click the chart once to give it focus, then:

    • B — Buy (uses current SL/TP from dashboard)
    • S — Sell
    • X — Close all positions on this symbol
    • C — Calculate (recalc lot size from current SL)
    • L — Toggle Lines mode (draggable Entry/SL/TP)
    • M — Toggle Monitor window

    Once you get used to Lines mode + hotkeys, your workflow becomes: drag SL line to where you want risk, drag TP line to target, glance at lot size on dashboard, press B or S. Entire trade entry in under 3 seconds.

    Settings Tab — One-Time Configuration

    You set this up once and forget it. Worth reviewing anyway:

    • Risk Type — % Balance is the most common. % Equity adjusts as you rack up floating profit. Fixed $ locks risk to a dollar amount regardless of balance changes.
    • Value — Most retail traders should sit at 0.5-1% per trade. Above 2% starts compounding losses dangerously fast.
    • R:R Ratio — 2.0 is the default. Higher if your strategy has low win rate (breakouts), lower if high win rate (mean reversion).
    • Server time bar — Shows broker time (with UTC offset) and CE(S)T time. Critical for FTMO since DD resets at CE(S)T midnight, not your broker’s midnight.

    Putting It All Together — Three Real Setups

    Setup 1: FTMO Gold Scalper

    • Risk Type: % Balance, Value: 0.5%
    • R:R: 2.0
    • Manage: Breakeven ON (Trigger 1R, Offset 5 pips), Partial Close ON (Close at 1R, Close 50%)
    • Protect: Daily DD ON, Type FTMO Rel, Limit 4.5%, Max Spread 50 pts
    • Session: London + NY only

    Setup 2: Swing EURUSD Breakout

    • Risk Type: % Balance, Value: 1.0%
    • R:R: 3.0
    • Pending orders: OCO ON (Buy Stop above resistance, Sell Stop below support)
    • Manage: ATR Trailing ON (Period 14, Mult 2.5), Breakeven OFF
    • Session: filter OFF (swing trades span sessions)

    Setup 3: Multi-Instrument Trend Follower

    • Risk Type: % Equity, Value: 0.75%
    • R:R: leave blank, manage exit manually
    • Manage: MA Trailing ON (MA 50), Breakeven OFF
    • Split Entry: 3 (distribute across three positions)
    • Monitor: always on, so you can close any position from any chart

    A Final Note on Discipline

    RiskFlow Pro is a tool, not a strategy. It cannot tell you when to trade or which direction. What it does is remove the excuses: “I forgot to move my stop,” “I took too much risk,” “I kept trading after hitting my daily limit.” Those excuses are what kill most traders. Setting up RiskFlow Pro correctly is setting up a system where those excuses are impossible.

    Pick one of the three setups above that matches your style, dial in the settings once, and let the EA do its job for a month. Then export your journal to CSV and review. The data will tell you which parts of your trading need work.

    Get RiskFlow Pro

    Free for the First 500 Downloads

    Every feature in this guide, in one compact dashboard on your MT5 chart. Position sizing, trade management, prop firm protection, and a built-in journal.

    Download Free on MQL5 →

    Works on any MT5 broker account · No registration on our site required

    New to RiskFlow Pro? Start with the Quick Start Guide — get your first trade placed in under 5 minutes, then come back here for the deep dive.

    Questions or requests for new features? Leave a comment on the MQL5 product page — that is where I actually read and respond.

  • RiskFlow Pro Quick Start: Your First Trade in Under 5 Minutes

    RiskFlow Pro Quick Start: Your First Trade in Under 5 Minutes

    Tutorial · MT5 · Free Tools · 8 min read

    You just downloaded RiskFlow Pro from MQL5. Maybe you are tired of opening Excel every time you want to calculate lot size. Maybe you blew a prop firm challenge last week because you forgot to move your stop to breakeven. Maybe you just want a cleaner way to trade manually.

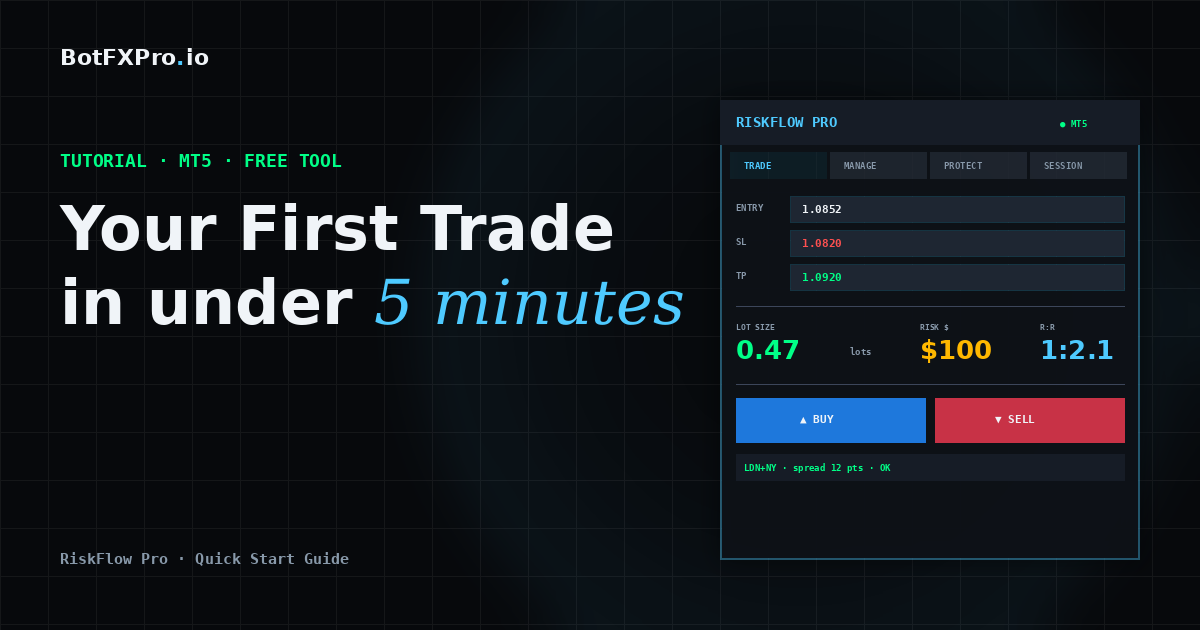
    Whatever brought you here, this guide gets you from zero to your first properly-sized trade in under 5 minutes. No fluff, no backstory on why risk management matters. Let us just get the thing running.

    What You Will Have By The End

    A working RiskFlow Pro dashboard on your chart, your personal risk settings dialed in, and one practice trade placed correctly with a calculated lot size.

    Before You Start

    Make sure you have these three things ready:

    • MetaTrader 5 installed and logged into a broker account. A demo account works fine for practice.
    • RiskFlow Pro downloaded from the MQL5 Market. If you have not downloaded it yet, grab it at the link at the bottom of this article.
    • Algo Trading enabled in MT5. Check the top toolbar — the Algo Trading button should be green, not red.

    Step 1 — Attach RiskFlow Pro to a Chart

    1. Open any chart you want to trade on. Gold, EURUSD, US30, whatever you usually trade. The timeframe does not matter — the EA works on any timeframe.
    2. In the MT5 Navigator panel (left side), expand the Expert Advisors folder. You will see RiskFlow Pro there.
    3. Drag RiskFlow Pro onto your chart. A settings window will pop up.
    4. In that window, make sure Allow Algo Trading is checked. You do not need to check Allow modification of Signals settings — that is unrelated.
    5. Click OK.

    You should now see a dashboard appear in the top-left corner of your chart. Six tabs across the top: Trade, Manage, Session, Protect, Settings, and Journal. The smiley face in the top-right corner of MT5 should be there too, confirming the EA is running.

    Troubleshooting

    If you do not see the dashboard, check that Algo Trading is actually enabled (the button in the MT5 toolbar should be green). If the dashboard shows but looks cut off, drag it to a less crowded part of your chart.

    Step 2 — Set Your Risk Profile

    This is the most important step. You only need to do it once, then the EA remembers.

    1. Click the Settings tab on the dashboard.
    2. You will see a Risk Type button at the top. Click it to cycle through four options:
      • % Balance — Risk a percentage of your total account balance. Most common choice.
      • % Equity — Risk a percentage of current equity. Useful with many open positions.
      • Fixed $ — Risk a fixed dollar amount every trade.
      • % Free Margin — Risk a percentage of available margin.
    3. In the Value field, enter your number. For example, if you chose % Balance and want to risk 1% per trade, type 1.0.
    4. Set your R:R Ratio. This is how RiskFlow Pro auto-calculates your take profit. For example, 2.0 means your take profit will be set at 2x your risk distance. Leave blank if you prefer to set TP manually.

    That is it for setup. The EA now knows exactly how to size every trade you make going forward.

    Step 3 — Place Your First Trade

    Go back to the Trade tab. You have two ways to enter a trade — pick the one that fits your style.

    Method A: The Simple Way (Market Order)

    1. Click the MARKET button. It turns green.
    2. In the SL field, type your stop loss price. For example, if gold is at 2650 and you want to stop out at 2645, type 2645.00.
    3. Leave TP blank (RiskFlow Pro will auto-calculate from your R:R ratio) or type a specific TP price.
    4. Look at the Lot display. It shows the exact lot size calculated from your risk settings and SL distance. Also check Margin — green means you have enough, red means your risk setting is too high for your account.
    5. Click BUY or SELL. Order goes through at market price.

    Method B: The Visual Way (Drag Lines)

    This is where RiskFlow Pro shines. If you have ever wanted to just drag your SL and TP around on the chart and see your lot size update live, this is for you.

    1. Click the LINES button. It turns green.
    2. Three colored lines appear on your chart: blue (Entry), red dashed (Stop Loss), green dashed (Take Profit).
    3. Drag any line to the level you want. The dashboard updates everything in real time — lot size, R:R ratio, margin, and order type.
    4. When you like what you see, click BUY or SELL.

    That is your first properly-sized trade. The blue, red, and green lines stay on your chart until the position closes, so you always know your levels at a glance.

    Step 4 — Let the EA Manage the Trade

    This is the part most traders skip, and it is also the part that separates profitable traders from the rest. Click the Manage tab.

    For your first trade, turn on just one thing: Breakeven.

    1. Toggle the BE button to ON. It turns green.
    2. Set Trigger R to 1.0. This means when price moves 1x your risk distance in your favor, the EA will move your stop loss to your entry price automatically.
    3. Set Offset pips to 2.0. This adds a small buffer so your stop sits just above (or below) entry — making breakeven actually a small profit to cover spread.

    Now walk away. When the trade works out, your stop moves to breakeven automatically. When it does not, your original SL protects you.

    Why This Matters

    This one setting alone will change your trading. No more “I should have moved my stop” regrets after a winner turns into a loser.

    Step 5 — Bonus: Turn On Prop Firm Protection

    If you are running an FTMO or other prop firm challenge, this takes 30 seconds and can save your entire account.

    1. Click the Protect tab.
    2. Toggle Daily DD Limit to ON.
    3. Click the DD Type button and set it to FTMO Rel (or whichever method your prop firm uses).
    4. Set the limit value. For FTMO, enter 4.0 for the 4% daily drawdown limit, or 4.5 if you want a small buffer.

    Done. The EA now watches your equity every tick. If you ever get close to the daily drawdown limit, new trades are blocked automatically. The floor line even shows you how much you have left to lose before the limit triggers.

    What to Do Next

    You have the basics working. That alone already makes you faster and safer than 80% of manual traders.

    If you want to go deeper — trailing stops, partial closes at multiple levels, OCO pending orders, virtual SL/TP stealth mode, and the full trade journal — the Advanced Features guide covers every tab in detail with real trading examples.

    Want alerts pushed to your phone when trades hit breakeven or your daily drawdown limit triggers? The MT5 notifications setup guide walks through push and email alerts end to end.

    Get RiskFlow Pro

    Free for the First 500 Downloads

    A professional manual trading dashboard. Position sizing, trade management, and FTMO risk protection — all in one compact panel on your chart.

    Download Free on MQL5 →

    Works on any MT5 broker account · No registration on our site required

    Found this guide useful? Leave a rating or comment on MQL5 — it helps other traders discover RiskFlow Pro, and helps me prioritize which features to add next.

  • Why Most Martingale EAs Blow Up — And What Actually Makes One Survive

    Risk Management · EA Strategy · 2026

    Why Most Martingale EAs Blow Up —
    And What Actually Makes One Survive

    BotFXPro.io · Chronos Algo · EURUSD H1 · 13+ yr backtest · 3+ yr live
    Backtest Period
    13+ Years
    Live Track Record
    3+ Years
    Max Drawdown
    32.9%
    Hard Portfolio Stop
    −65%

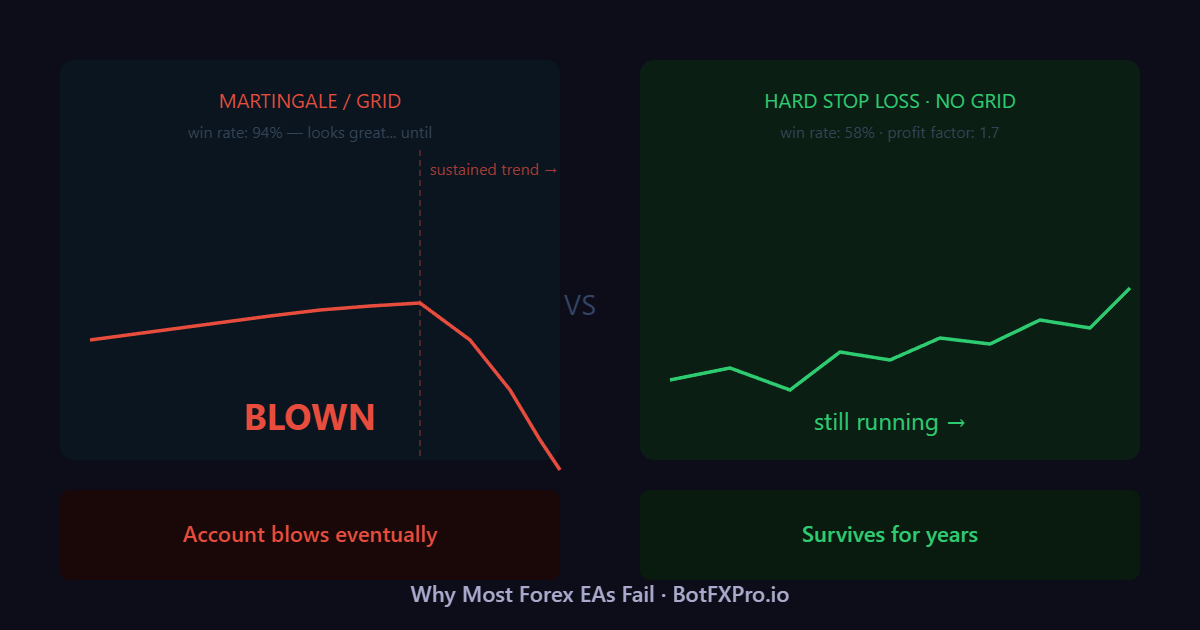
    The math behind why standard martingale fails is simple: without a hard stop, one extended adverse run wipes everything. The strategy assumes the market must eventually reverse — but markets can trend far longer than your margin allows.

    What’s less obvious is that the structural flaws in most martingale EAs go deeper than just “no stop loss.” After running a martingale-based EA on EURUSD H1 for over three years live and backtesting across 13+ years of data, here’s exactly what separates a system that survives from one that eventually doesn’t.

    The Core ProblemStandard martingale doubles lot size after every loss, with fixed-distance entries regardless of market structure. No edge on entry. No cap on exposure. No exit when things go truly wrong. It’s not a strategy — it’s a slow-motion account transfer.

    What a Surviving System Actually Does

    01 / 06

    NOT Pure Martingale — Adaptive Lot Multiplier

    Classic martingale doubles immediately: order 1 at 0.01, order 2 at 0.02, order 3 at 0.04. Exposure compounds fast. The second order in a structured recovery sequence, by contrast, opens at the same lot size as the first — not doubled. Only as more orders accumulate does the multiplier gradually increase.

    More importantly, if open recovery orders exceed a threshold, the system automatically reduces the multiplier. This is the opposite of what classic martingale does at exactly the wrong moment. The exposure curve flattens instead of accelerating.

    Lot size per order: Classic Martingale vs. Adaptive (relative to initial lot = 1×, max scale = 128×)
    Classic · Order 1
    Classic · Order 2
    Classic · Order 3
    Classic · Order 4
    Classic · Order 5
    16×
    Classic · Order 6
    32×
    Classic · Order 7
    64×
    Classic · Order 8
    128×

    Adaptive · Order 1
    Adaptive · Order 2
    Adaptive · Order 3
    Adaptive · Order 4
    Adaptive · Order 5
    Adaptive · Order 6
    12×
    Adaptive · Order 7
    18×
    Adaptive · Order 8
    27×

    The practical difference is significant. In a 5-order worst-case sequence, classic martingale has accumulated 16× the initial lot size by order 5. The adaptive approach reaches only 8× by order 5, then scales gradually to 12×, 18×, and 27× for orders 6–8 — versus classic martingale which would reach 32×, 64×, 128×. Same number of recovery orders: dramatically different peak exposure per order.


    02 / 06

    Every Entry Has a Real Edge — Not Random Grid Spacing

    Most martingale systems place recovery orders at fixed pip intervals regardless of what price is doing — 20 pips down, 40 pips down, 60 pips down — with no reference to market structure whatsoever.

    A properly structured system applies the same entry logic to recovery orders as to initial orders. Each position in a recovery sequence is filtered against market conditions to identify higher-probability reversal zones rather than arbitrary price levels. The result: fewer orders needed per cycle, better average entry prices, and faster recovery.

    Why this mattersRecovery speed is everything in a martingale system. A cycle that closes in 3 orders under a structured approach might take 6–7 orders under random grid spacing for the same price move. Fewer orders = lower peak exposure on every single trade. This is also what enables the adaptive multiplier to work — you can afford to start recovery orders at 1× because intelligent entry selection does part of the work that brute-force lot scaling would otherwise require.


    03 / 06

    Exposure Per Cycle Is Hard-Capped

    If a system can open unlimited orders in a single recovery sequence, it will eventually meet market conditions that exhaust your capital before it exhausts the losing streak. The question isn’t whether this happens — it’s when.

    A hard cap on orders per cycle changes the risk profile fundamentally. The worst-case scenario is calculable before you deploy real money. You can answer the question: “If every recovery order in this cycle closes at a loss, what is my maximum drawdown?” — and get an actual number, not a range that extends to account wipeout.

    Feature Standard Martingale Hard-Capped System
    Max orders per cycle Unlimited Fixed (e.g., 8)
    Worst-case calculable? No Yes — before live trading
    Capital requirement Undefined Specific and plannable
    Margin call risk Inevitable over time Bounded and manageable

    This one structural difference is what makes it possible to publish real drawdown numbers — no asterisk, no “results may vary up to account wipeout.” Position sizing is designed around a pre-calculated worst case, not wishful thinking about how bad things can get.


    04 / 06

    Portfolio-Level Kill Switch

    This is the single most important structural feature, and the one most often absent from retail martingale EAs. A hard stop loss enforced at the portfolio level — not per trade, not per cycle, but across the entire account — that closes all positions and halts the EA when cumulative drawdown hits a defined threshold.

    For Chronos Algo on EURUSD: that threshold is −65%. The EA has never come close to triggering it in 13+ years of backtesting or 3+ years live. But it exists, it’s enforced by code, and it converts an unlimited-risk strategy into a defined-risk strategy.

    The Key PrincipleDefined risk is manageable. Undefined risk is not. The difference isn’t the size of the number — it’s whether the number exists at all. A −65% hard stop is still a large loss. But a trader who knows their maximum downside can make rational capital allocation decisions. A trader with no stop cannot.

    Most EA vendors omit this because it forces them to publish a real worst-case figure. Publishing that number feels like marketing suicide. In reality, it’s the opposite — it’s the only thing that makes the risk profile honest.

    Two More Differences Nobody Talks About

    05 / 06

    The Backtest Trap — Why 10-Year Results Can Still Lie

    Backtests are easy to fabricate — not through dishonesty, but through the mechanics of how they work. Martingale EAs are particularly susceptible because the parameters controlling recovery behavior (lot multiplier, grid distance, max orders) have enormous impact on results and are easy to over-optimize.

    Run the same martingale EA with 20 different parameter sets, pick the one that looks best, and publish those results. You’ve found a set that happened to fit the past 10 years of data. You haven’t found a system that’s robust to the next 10.

    What Actually Signals RobustnessConsistent behavior across multiple market regimes — trending years, ranging years, high-volatility and low-volatility periods. Not a smooth equity curve optimized to look perfect. Drawdown periods should be visible, not suspiciously absent. Results on a live account that started years ago should roughly match the backtest shape — not significantly outperform it.

    The Chronos Algo backtest covers 2013–present, including the 2014–2015 EUR collapse, 2020 COVID volatility spike, and 2022 rate-shock trending conditions. The live account has been running since 2022 — independently verified via MQL5 Signals and Myfxbook — and the equity curve shape across those conditions matches the backtest profile. That match is what matters, not the peak return figure.


    06 / 06

    What Transparency Actually Looks Like in EA Marketing

    Almost every EA listing leads with a return percentage. Some lead with “verified results.” Almost none lead with maximum drawdown, honest strategy labeling, or a clear explanation of how the system loses money.

    The pattern is predictable: screenshot of equity curve → impressive return % → vague mentions of “smart” or “adaptive” logic → no discussion of downside. The user is expected to assume the system is low-risk because the presentation avoids discussing risk.

    What Most EAs Show What You Should Demand
    Return % only Max drawdown — actual historical peak-to-trough
    “Non-martingale” or “safe grid” Explicit strategy labeling: martingale? grid? hedging?
    Backtest screenshots only Live account on Myfxbook or MQL5 Signals
    30–90 day live track record Multi-year live results across different market regimes
    No discussion of worst case Hard stop defined, worst case calculable before you deposit

    Transparency isn’t a marketing angle — it’s what lets a serious trader make an informed decision. If a vendor can’t tell you the maximum historical drawdown, what happens when the worst recovery cycle occurs, or exactly how the system exits losing positions, that’s not a gap in the pitch deck — it’s a gap in the risk management.

    The Bottom Line

    Martingale isn’t inherently fatal. The strategies that fail aren’t failing because they use martingale — they’re failing because they stack unlimited exposure on top of no-edge entries with no emergency exit and optimistic backtests that hide the downside.

    What survives: adaptive exposure that doesn’t compound at the worst moment, entry logic that creates real edge on every order, hard caps that make worst-case scenarios calculable, and a portfolio kill switch that converts unlimited risk into defined risk.

    The live numbers for Chronos Algo on EURUSD H1: ≈32.9% max drawdown over 3+ years, hard stop at −65%, results independently verified. That’s not impressive on a return leaderboard. It’s honest — and that’s the point.

    Chronos Algo — EURUSD H1

    13+ years backtested. 3+ years live. Max drawdown ≈32.9%. Independently verified on MQL5 Signals and Myfxbook.

    View Chronos Algo →
    Live Signal ↗

    Risk disclosure: Trading forex with automated systems involves significant risk of loss. Past performance, including backtested results, does not guarantee future results. Maximum drawdown of 32.9% observed in live trading. Hard portfolio stop at −65%. Only trade with capital you can afford to lose.

    Related Reading
    Risk Management

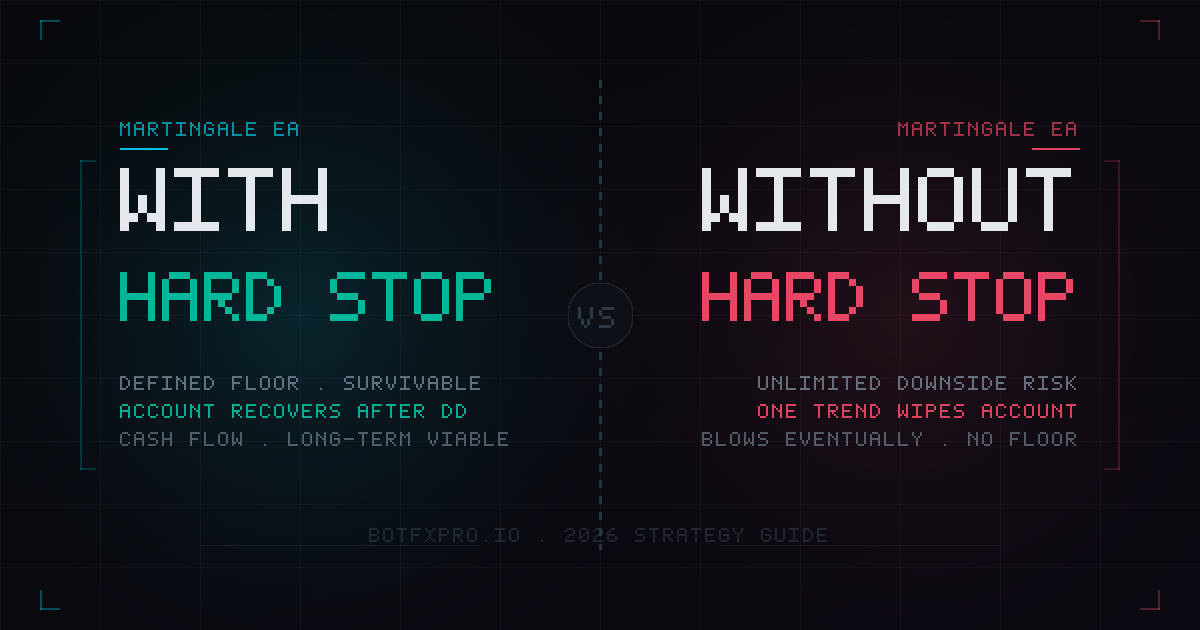
    Martingale EA With a Hard Stop vs Without: A Deep Dive for Serious Traders

    EA Reviews

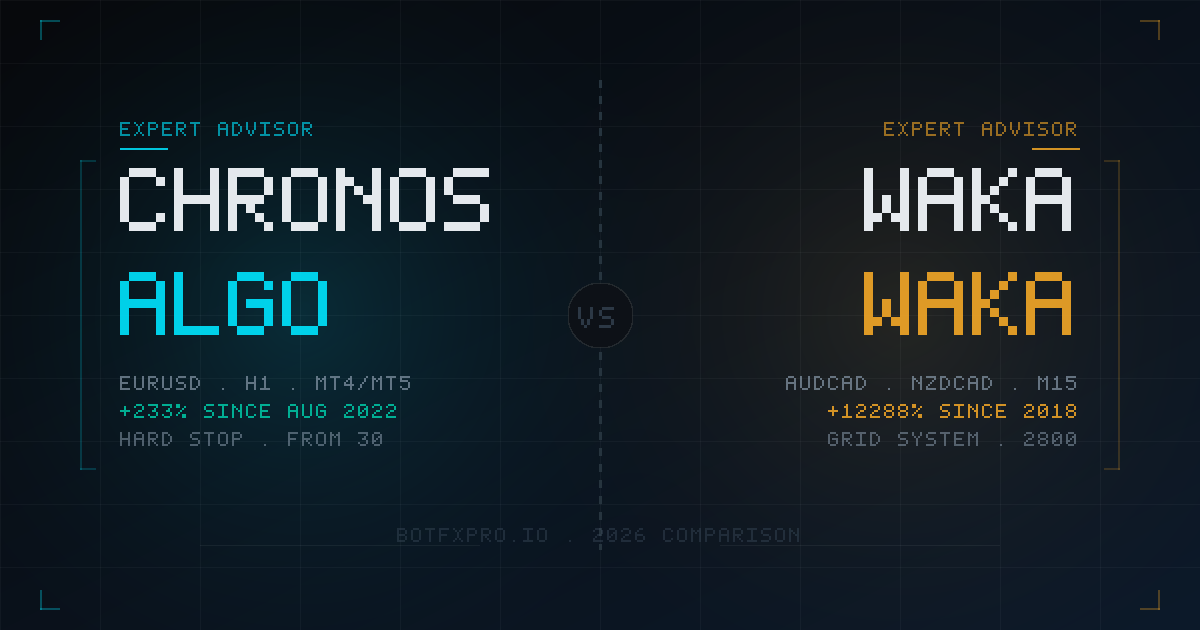
    Chronos Algo vs Waka Waka (2026): A Straightforward Comparison

  • Martingale EA With a Hard Stop vs Without: A Deep Dive for Serious Traders

    Martingale EA With a Hard Stop vs Without: A Deep Dive for Serious Traders

    EA Strategy · Risk Management · 2026

    Martingale EA With a Hard Stop vs Without:
    A Deep Dive for Serious Traders

    botfxpro.io · Martingale risk structure · Hard stop loss · Cash flow strategy

    If you’ve spent any time evaluating automated trading systems, you’ve encountered martingale. It’s one of the most polarizing strategies in retail forex — equally loved for its consistent short-term performance and feared for its catastrophic failure modes.

    The debate around martingale usually focuses on the wrong things: win rate, monthly return, drawdown percentage. These metrics matter, but they don’t answer the most important structural question.

    Does the system have a hard portfolio stop loss — and what happens when it triggers?

    That single design decision creates a fundamental divide between two types of martingale EA. They can look nearly identical for months or years. Then, when an adverse market event arrives, one survives and one doesn’t. This article explains why — mechanically, mathematically, and practically.


    How Martingale Actually Works: The Full Mechanics

    Martingale originated as a gambling strategy. In forex trading, it translates into a position averaging system. When the market moves against the initial trade, the EA opens additional positions in the same direction with progressively larger lot sizes. When the market reverses and reaches the basket’s profit target, all positions close simultaneously at a net profit.

    The mechanics create three distinctive characteristics:

    • High win rate: Because most short-term adverse moves eventually reverse, the basket closes profitably the majority of the time. Win rates of 80–95% are common. This is real — not marketing.
    • Asymmetric loss exposure: The losses that do occur are disproportionate. A single losing sequence can be 5×, 10×, or 20× the size of a typical winning trade. Win rate looks excellent right up until a deep losing sequence overwhelms the account.
    • Correlation with market regime: Martingale performs well in ranging or mean-reverting conditions. It struggles severely in trending markets — particularly strong, sustained directional moves that don’t reverse before the basket grows too large.

    The Mathematics of Position Scaling

    A typical martingale EA doubles lot size with each additional position. Starting at 0.01 lots on a $1,000 account:

    Position Lot size Cumulative exposure Relative to initial
    1 (initial) 0.01 0.01
    2 0.02 0.03
    3 0.04 0.07
    4 0.08 0.15 15×
    5 0.16 0.31 31×
    6 0.32 0.63 63×
    7 0.64 1.27 127×
    8 1.28 2.55 255×

    By position 8, cumulative lot exposure is 255 times the initial position. This is the core danger: exposure grows geometrically while account balance grows linearly. A system with no ceiling on this process will eventually hit a market condition where geometric growth outpaces the account. Without a hard stop, the result is a margin call.

    What a Hard Portfolio Stop Loss Actually Does

    A hard portfolio stop loss places a ceiling on this geometric exposure. It defines, in advance, the maximum floating loss the system will tolerate before force-closing all positions.

    Critically, this stop operates at the portfolio level, not the individual trade level. It monitors the combined floating loss of all open positions simultaneously. When total floating loss reaches the defined threshold — expressed as a percentage of account equity — every open position closes at once.

      Martingale without hard stop Martingale with hard stop
    Monthly performance Similar Similar
    Win rate 80–95% 80–95%
    Worst case Account wipeout (-100%) Defined loss (e.g. -60 to -65%)
    Account survival Not guaranteed Guaranteed floor
    Resumable after drawdown No — account gone Yes — trading continues

    The monthly returns are comparable. The difference is entirely in what happens when things go wrong. It converts unlimited risk into defined risk, removes the margin call scenario, and forces the system to be honest about its actual risk profile.


    All Three BotFXPro Martingale EAs Have Hard Stops

    Every martingale EA on BotFXPro carries a hard portfolio stop loss. This is not optional or configurable — it’s a structural requirement.

    Chronos Algo

    EURUSD · H1 · MT4 + MT5

    Entry filtered by 7-indicator confluence (Stochastic, ADX, MACD, RSI, CCI, ATR, Envelopes). Reduces trade frequency and limits sequences that reach deep recovery stages.

    Live since August 2022 — 3+ years continuous. Verified withdrawals on MQL5. Hard stop never triggered in 12+ years of backtesting or live trading.

    • Hard portfolio stop: -65%

    Velocity & Sentinel MT5

    USDCAD + AUDCAD · M15 · MT5

    Two independent martingale systems running in parallel on deliberately low-correlation pairs. When USDCAD is in a drawdown sequence, AUDCAD is statistically unlikely to be in simultaneous deep drawdown.

    The cross-pair design provides an additional layer of portfolio diversification beyond the hard stop itself.

    • Hard portfolio stop: per system

    QuantLot Expert

    EURUSD · M15 · MT5

    Hard portfolio stop at -60% with an additional cap of 8 recovery positions maximum. The position cap limits not just the loss floor but the exposure path that leads to it.

    Unlike uncapped systems where position 15–20 is theoretically possible, exposure profile is fully defined by position 8.

    • Hard portfolio stop: -60% · Max 8 positions


    Why Backtest Quality Separates Serious Systems from Marketing Tools

    Most retail EA vendors include a backtest. Very few use one that actually means anything.

    The standard approach uses interpolated tick data — approximated price points that don’t reflect actual bid/ask spread behavior, requotes, or micro-volatility that real trading produces. This type of backtest can be generated in minutes, tuned to produce exceptional results, and presented as evidence of robustness. It isn’t.

    The difference between a marketing backtest and a genuine one comes down to two variables: data quality and time horizon.

    100% Real Tick Data

    MetaTrader’s Strategy Tester offers three data quality options. Most published backtests use interpolated data because it runs faster and typically produces better-looking results.

    Real tick data uses the actual historical tick-by-tick price feed — every price update the broker received during the test period. For a martingale system, this matters enormously. Martingale baskets are sensitive to short-term price behavior. Interpolated data smooths out spread widening during news events, volatility spikes at session opens, and real pip-by-pip movement during sustained trends. Real tick data doesn’t.

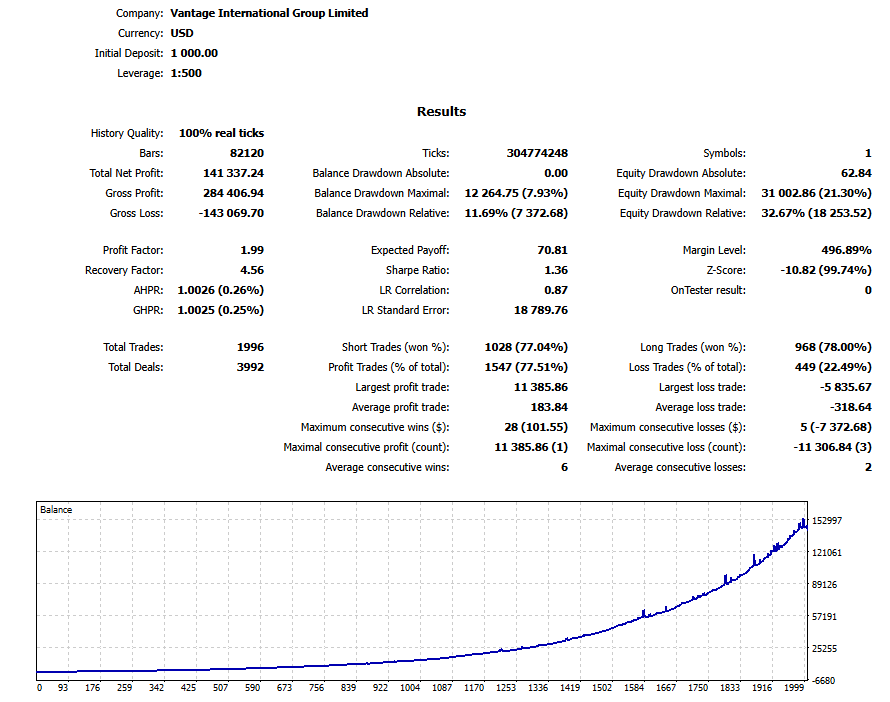
    A backtest run at 100% real tick data quality cannot be gamed by smoothing. Either the system handled those market conditions or it didn’t. All BotFXPro EA backtests are run at 100% real tick data quality.

    10+ Years of Test History

    Martingale systems have a specific testing vulnerability: a short backtest can look excellent simply by avoiding the market conditions that would stress the system most. A 2-year backtest covering a calm, ranging period will produce impressive statistics. The same system run over 10–12 years will encounter multiple major trend events, currency crises, central bank interventions, and regime changes.

    Chronos Algo has been backtested over 2013–2024 — a 12-year period that includes:

    • The EUR/USD collapse of 2014–2015 (1,000+ pip sustained move)
    • Brexit volatility in 2016
    • COVID-related currency dislocations in 2020
    • The sharp USD strengthening cycle of 2022

    The -65% portfolio stop was not triggered once across any of these events. Maximum equity drawdown reached 32.40% — closely matching the live account’s ~33% recorded drawdown.

    Backtest–Live Alignment: The Real Credibility Signal

    The most meaningful backtest validation isn’t the backtest statistics themselves — it’s whether the live account behaves consistently with the backtest. A system fitted to historical data typically performs differently in live conditions. Parameters were optimized for past market structure, and when conditions change, the edge degrades. This is overfitting, and it’s the reason most EAs underperform their backtests significantly in live deployment.

    Chronos Algo: Backtest vs Live Comparison

    Backtest max equity drawdown (2013–2024): 32.40%

    Live recorded max drawdown (Aug 2022–present): ~33%

    This alignment — across a 3+ year live period including multiple market cycles — indicates the system’s logic reflects genuine market behavior, not historical curve-fitting. The -65% hard stop was calibrated on a backtest that accurately reflected real market conditions, which gives the floor genuine meaning rather than being an arbitrary number.


    Martingale as a Monthly Cash Flow Engine

    When managed correctly, a hard-stop martingale system has a specific financial advantage that few trading strategies can match: consistent monthly cash flow.

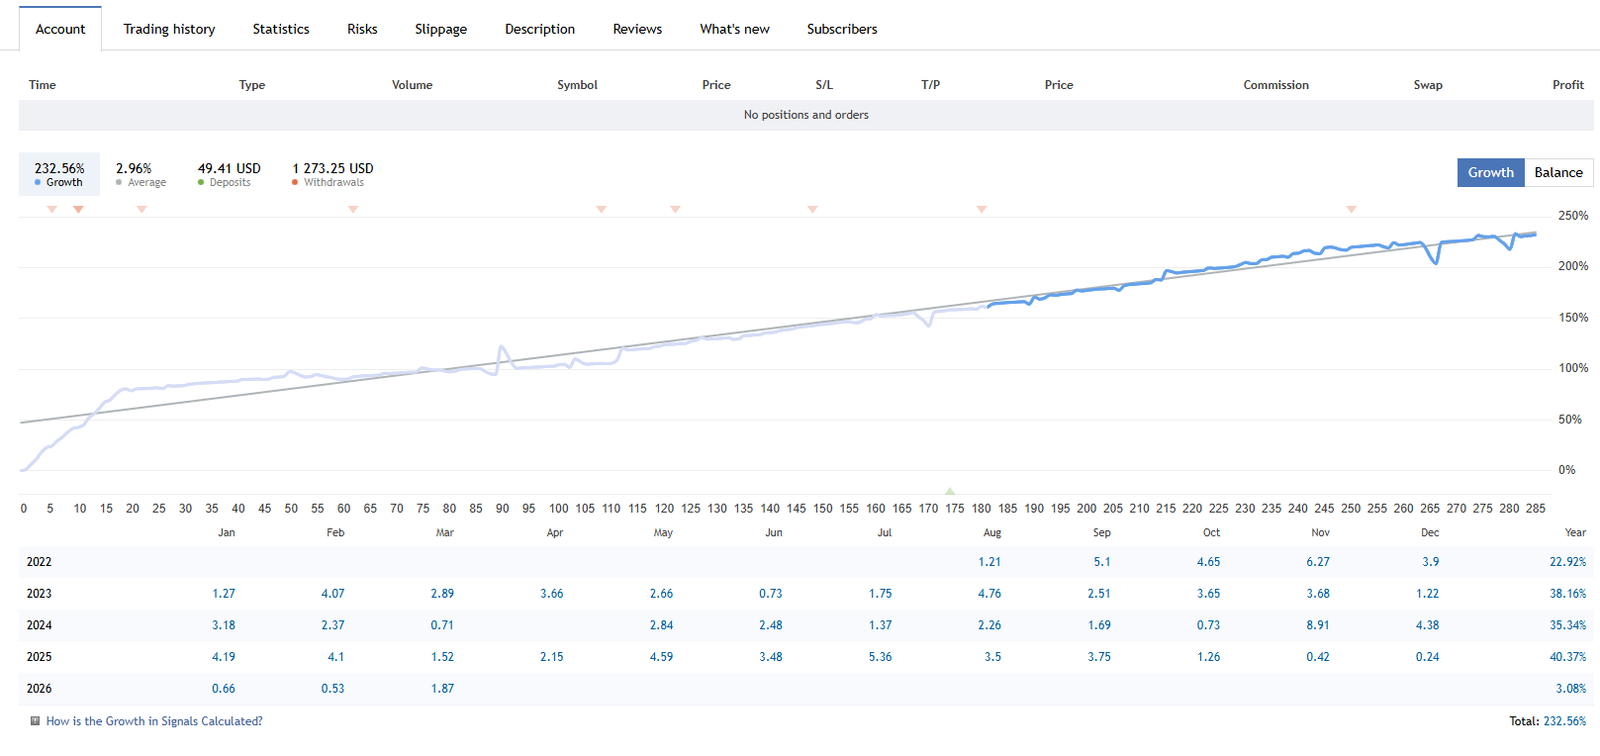
    Because win rate is high and most baskets close profitably, the account grows in a relatively predictable pattern month over month. Chronos Algo has averaged approximately ~3% per month (simple average, Myfxbook) — or roughly ~5% compounded for accounts that reinvest without withdrawals.

    This consistency makes hard-stop martingale EAs well-suited to a specific financial strategy: use the EA as a cash flow asset, not a pure growth investment.

    The Capital Recovery Framework — $10,000 Example

    Phase 1 — Compounding (approx. months 1–28)
    At ~3% per month compounded, a $10,000 account reaches approximately $20,000 in roughly 24–28 months. At that point, withdraw $10,000 — the original deposit. The remaining $10,000 continues running.

    Phase 2 — Free cash flow (month 29 onward)
    With $10,000 running at ~3% monthly average, the account generates approximately $300 per month on a position where your original capital has been fully returned.

    Withdrawal frequency Accumulated before withdrawal Approximate amount
    Monthly $300 $300
    Quarterly ~$950 (with compounding) ~$950
    Semi-annually ~$2,000 ~$2,000
    Annually ~$4,300 (at 3% compounded) ~$4,300

    Leaving profits to compound between withdrawals accelerates growth of the base. By the semi-annual mark, the base has grown to ~$11,600, so the 6-month withdrawal exceeds a simple 6× monthly figure.

    What “Zero Net Cost” Actually Means

    Once you’ve withdrawn your original $10,000, the EA continues running on profit balance. The hard stop still exists — a -65% drawdown event would reduce the profit balance significantly — but the capital at risk is no longer money you originally invested. You’ve restructured the risk: from “money I need to protect” to “gains I can afford to risk further.” This doesn’t eliminate risk. It restructures it into a form that’s psychologically and financially much easier to manage.

    Early Withdrawal: A Valid Alternative Strategy

    The framework above assumes full compounding during Phase 1. But there’s a legitimate alternative: withdraw profits frequently from the start to reduce portfolio risk progressively.

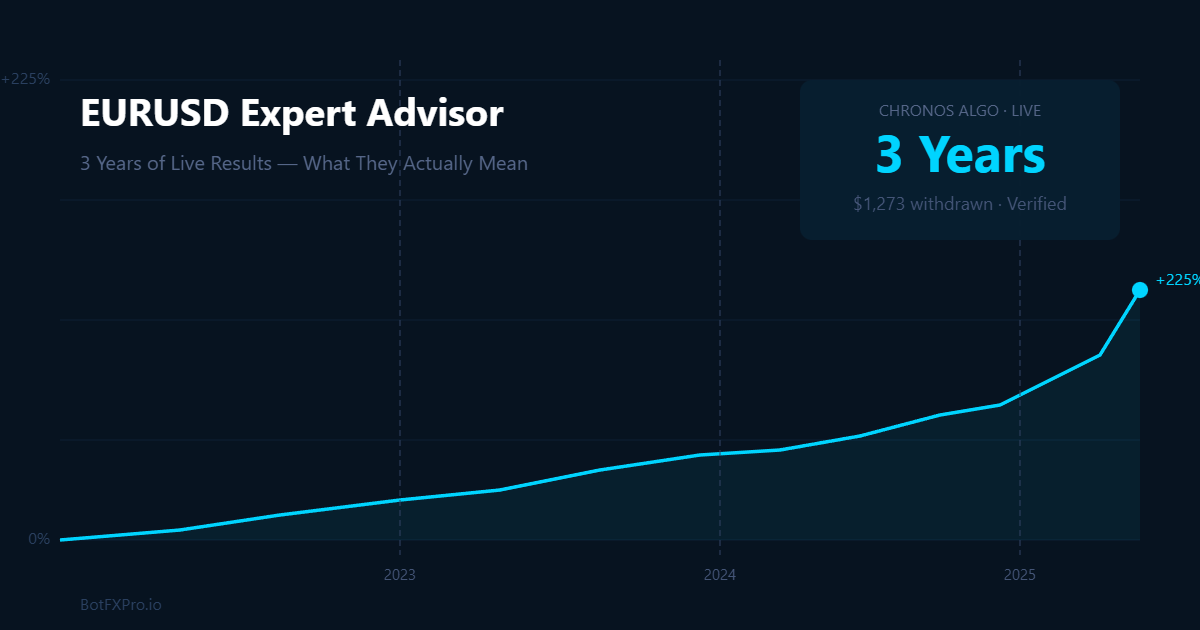
    This is the approach the Chronos Algo live account has used. Rather than compounding aggressively toward capital recovery, withdrawals were made regularly in the early months — $1,273.25 in total verified withdrawals from an initial $1,000 deposit over 3+ years. Capital recovery takes longer, but the live account balance at risk decreases steadily from the start.

    Strategy Best for
    Compound fully, then withdraw capital in one event Traders who can tolerate sustained exposure while targeting full capital recovery
    Withdraw regularly from the start Traders who want to reduce capital at risk progressively, or need current income
    Hybrid — withdraw partial profits, leave remainder to compound Traders who want a balance of current income and base growth

    How to Verify Whether a System Has a Real Hard Stop

    Before purchasing any martingale EA, verify the hard stop independently rather than taking the vendor’s word for it.

    • Check the trade history on Myfxbook. Download the full trade history and look for the SL (stop loss) field. For a basket-level hard stop, individual trades may show no per-trade stop — that’s normal. Look for documentation of the portfolio-level trigger mechanism and threshold.
    • Look at signal page comments and history. If the system has gone through a significant drawdown event, signal comments will usually show community discussion. Look for events where the portfolio stop triggered — this confirms the mechanism is real and actually fires under live conditions.
    • Ask the vendor directly: “At what portfolio drawdown percentage do all open positions force-close? Is this handled by a server-side stop or by EA logic on the client terminal?” A vendor with a genuine hard stop answers this immediately and specifically. Vague answers about “risk management features” are a red flag.
    The Question to Ask Any Martingale EA Vendor

    “Does every trade have a hard stop loss defined at entry? At what portfolio drawdown percentage are all positions force-closed?”

    If the answer is specific and documented, that’s a system worth evaluating. If the answer is vague — or if the trade history shows no stop loss values — that system carries unlimited downside risk regardless of how good the historical performance looks.

    See All Three BotFXPro Hard-Stop Martingale EAs

    Chronos Algo, Velocity & Sentinel MT5, and QuantLot Expert — each with a defined hard portfolio stop and 100% real tick backtests.

    View All EAs →

    Risk Disclosure: All martingale EAs described carry substantial risk of loss. Hard stop losses limit but do not eliminate loss — a -60% or -65% drawdown event results in significant reduction of account value. Past performance including verified live records and backtest results does not guarantee future results. The “zero net cost” cash flow framework described assumes the EA continues to perform at historical averages, which cannot be guaranteed. All trading of leveraged instruments may not be suitable for all investors. This article is for informational purposes only and does not constitute financial advice.
  • Chronos Algo vs Waka Waka (2026): A Straightforward Comparison for Serious Traders

    Chronos Algo vs Waka Waka (2026): A Straightforward Comparison for Serious Traders

    Expert Advisor Comparison · 2026

    Chronos Algo vs Waka Waka
    A Straightforward Comparison for Serious Traders

    botfxpro.io · EURUSD / AUD-NZD crosses · Martingale basket systems · Verified live records

    Waka Waka is one of the most recognized Expert Advisors on the MQL5 marketplace — with a live track record stretching back to 2018, verified on Myfxbook, and thousands of copies sold. Chronos Algo is a more recent EA from BotFXPro, live since August 2022, trading EURUSD on the H1 timeframe.

    Both are martingale basket systems. Both have multi-year verified live records. But beyond that surface similarity, the two EAs differ significantly in strategy design, pairs traded, drawdown behavior, transparency — and price.

    This article is a direct comparison. No marketing language. Just the numbers and the trade-offs that matter when deciding where to put real capital.


    At a Glance

    Chronos Algo

    • EURUSD · H1 · MT4 + MT5
    • Martingale basket strategy
    • Hard portfolio stop at -65%
    • 3+ years live · Myfxbook verified
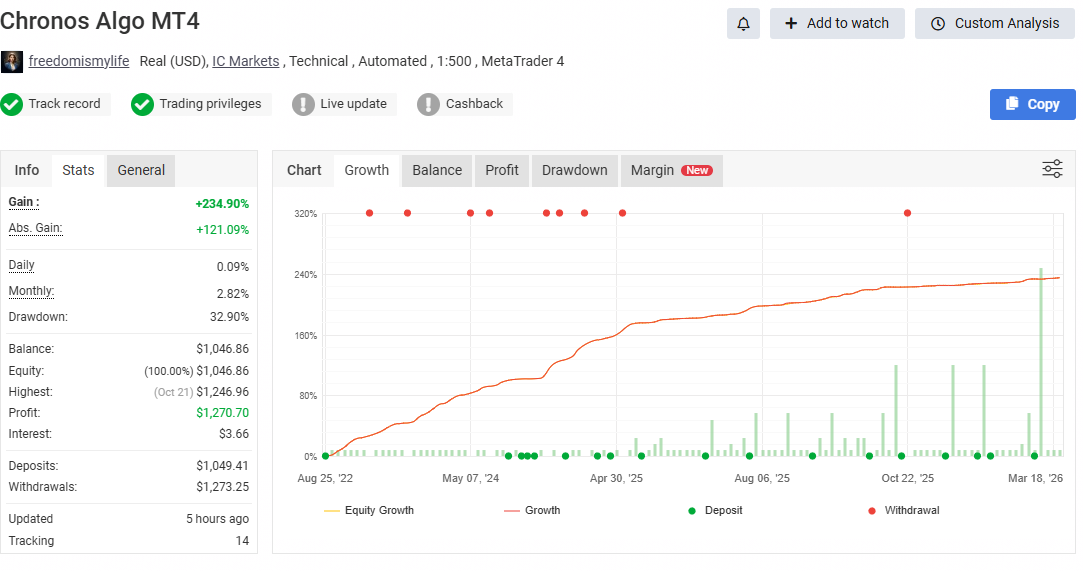
    • +233% gain since Aug 2022
    • From $30 · lifetime license

    Waka Waka

    • AUDCAD, AUDNZD, NZDCAD · M15
    • Grid + martingale strategy
    • No fixed hard portfolio stop
    • 7+ years live · Myfxbook verified
    • +12,000%+ since Jun 2018 (signal)
    • $2,800 · lifetime license

    Strategy: How Each EA Actually Trades

    Chronos Algo — Martingale Basket on EURUSD H1

    Chronos Algo trades EURUSD on the 1-hour chart using a multi-indicator entry filter that requires agreement across Stochastic, ADX, MACD, RSI, CCI, ATR, and Envelopes before opening a position. This deliberate filtering reduces how often the EA enters the market, limiting the frequency of recovery sequences.

    When the market moves against the initial position, the EA opens additional positions in the same direction with progressively larger lot sizes — a martingale basket. Exit logic is tiered: small baskets close at a profit target; larger baskets shift to breakeven exit, closing all positions the moment equity recovers to entry level.

    A hard portfolio stop loss at -65% closes all open positions automatically if account drawdown reaches that threshold. The -65% floor defines the absolute worst-case outcome.

    Waka Waka — Grid System on AUD/NZD Crosses

    Waka Waka trades AUDCAD, AUDNZD, and NZDCAD on the M15 timeframe. These cross pairs were chosen for their tendency to range rather than trend aggressively, which suits grid-style recovery logic. The EA uses ML-based pattern recognition as an entry filter and opens additional positions at regular grid intervals when the market moves against the initial trade.

    The developer describes the system as an “advanced grid system” rather than pure martingale, as lot sizes don’t always double. Risk is managed through position sizing controls rather than a fixed stop loss, meaning the EA can theoretically hold open positions indefinitely if the market trends strongly against it.

    The Core Risk of Both Systems

    Both Chronos Algo and Waka Waka share the same fundamental characteristic: they add to losing positions. In ranging or mean-reverting conditions, this works well. In sustained trending conditions — particularly sharp, one-directional moves — both systems can accumulate significant floating loss before recovering. Understanding this is essential before using either EA with real capital.


    Risk Structure: Side by Side

    Factor Chronos Algo Waka Waka
    Core strategy Martingale basket · trend entries Grid + martingale · ranging pairs
    Martingale Yes — core, fully disclosed Yes — grid spacing, configurable
    Per-trade stop No — basket managed as unit No — position sizing controls
    Portfolio hard stop Yes — closes all at -65% No fixed hard stop (configurable)
    Max drawdown (live) ~33% (Myfxbook verified) ~66% (signal account)
    Worst-case outcome -65% (system closes at this floor) Theoretically -100% without risk limits
    Pairs traded EURUSD only AUDCAD, AUDNZD, NZDCAD
    Timeframe H1 M15
    Platforms MT4 + MT5 MT4 + MT5

    The most significant structural difference is the hard portfolio stop loss. Chronos Algo will automatically close all positions if floating loss reaches -65% of equity — defining the worst-case outcome before you start trading. Waka Waka does not have an equivalent fixed floor in its default configuration.


    Live Track Records

    Chronos Algo

    Cumulative Gain
    +233%
    Since Aug 2022 · MT4 live
    Max Drawdown
    ~33%
    Live recorded · hard floor -65%
    Verified Withdrawals
    $1,273
    Verified on MQL5
    Live Since
    Aug ’22
    3+ years continuous

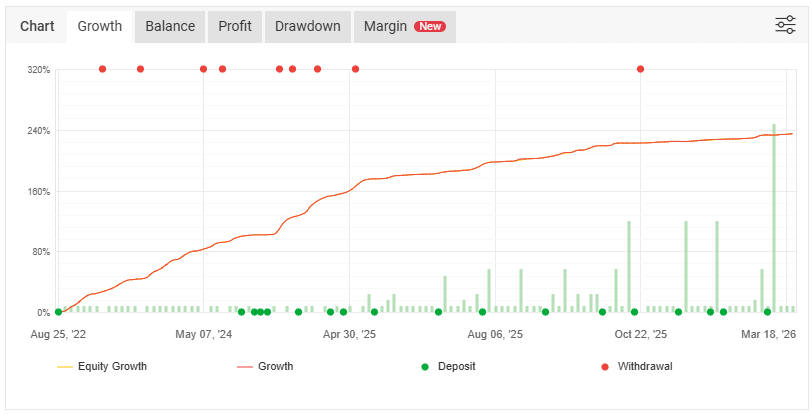
    Chronos Algo has been running on a live MT4 account since August 2022 with the same initial $1,000 deposit and no additional capital injections. Gains have been periodically withdrawn — $1,273.25 in verified MQL5 withdrawals as of 2026. An MT5 account was added in 2025 as a parallel live track record.

    Waka Waka

    Cumulative Gain
    +12,288%
    Since Jun 2018 · signal account
    Max Drawdown
    ~66%
    Signal account recorded
    Abs. Gain
    +458%
    On total deposited capital
    Live Since
    Jun ’18
    7+ years continuous

    Waka Waka’s signal account (MischenkoValeria on MQL5) has been running since June 2018 — a genuinely long live record. Total deposits of $3,500 against withdrawals of $4,352 mean capital has been added at certain points in its history, which is important context when interpreting the cumulative gain percentage. Absolute gain on total deposited capital is approximately +458%.

    A Note on Martingale Track Records

    One inherent challenge when evaluating martingale-based EAs: the developer’s own account — which serves as the primary marketing asset — is managed with more flexibility than a typical user’s account. When markets trend strongly against open positions, a developer can choose to add capital, reduce risk settings, or close positions manually to prevent a reset. User accounts running default settings don’t have the same backstop.

    This doesn’t mean the track record is invalid — but it’s a meaningful difference between what you see on the signal page and what your account will experience.


    Monthly Returns & Value Comparison

    Metric Chronos Algo Waka Waka (signal)
    Avg monthly gain ~3% simple (Myfxbook) · ~5% compounded ~5.2% (stated monthly, signal)
    Profitable months ~80% of months since Aug 2022 70+ consecutive profitable months (claim)
    Worst single month Drawdown periods, no forced reset -84% recorded in one user account (May 2024)
    License price From $30 (per account, lifetime) $2,800 (lifetime)

    Chronos Algo averages approximately ~3% per month on a simple basis according to Myfxbook. For accounts that reinvest returns without withdrawals, the compound monthly rate works out to roughly ~5% — comparable to Waka Waka’s stated ~5.2%. The break-even analysis below uses the conservative 3% simple figure.

    Break-Even Analysis — $1,000 Account, ~3% Monthly

    Chronos Algo ($30 starter): License recovered in 1 month. Net profit begins almost immediately.

    Waka Waka ($2,800): License cost requires ~93 months of Chronos-equivalent returns to break even — before accounting for any drawdown periods.

    For larger accounts ($10,000+), the proportional impact of the license cost decreases significantly for Waka Waka. At that scale, the decision shifts to track record depth and strategy preference.


    Which EA Fits Which Trader?

    You want a defined worst-case loss before you buy Chronos Algo — the -65% hard stop defines the maximum outcome
    You prefer AUD/NZD pairs and M15 timeframe Waka Waka — optimized specifically for those cross pairs
    Starting with limited capital ($500–$2,000) Chronos Algo — $30 license, $1,000 minimum recommended capital
    You value the longest possible live track record Waka Waka — 7+ years live, genuine market cycle history since 2018
    Running multiple accounts Chronos Algo — per-account pricing from $30 scales efficiently
    You want verified withdrawals from the live account Chronos Algo — $1,273.25 in verified MQL5 withdrawals
    You have $5,000+ and want a well-known system Either — evaluate strategy fit and drawdown tolerance at that capital level

    Final Verdict

    Waka Waka is a legitimate, well-established EA with a longer track record than almost anything else in the retail market. Its 7+ years of verified live performance is genuinely unusual. If you’re choosing based on track record depth alone, Waka Waka has the edge.

    Chronos Algo is newer, trades a single pair, and lacks the decade-long history. But what it offers in exchange is a clearly defined risk structure — a hard -65% portfolio stop that removes the ambiguity of open-ended drawdown — combined with a price point that makes it accessible to traders with modest capital.

    For traders primarily concerned with understanding exactly what can go wrong before they start, Chronos Algo’s transparent risk floor is a genuine differentiator. For traders with larger accounts who want the longest possible verified history and are comfortable managing grid-based risk exposure, Waka Waka remains a credible option — provided capital is sized appropriately.

    Neither system eliminates the fundamental risk of martingale and grid trading. Both can produce significant drawdowns in sustained trending conditions. That risk is built into the strategy — and is true of any EA in this category.

    See Chronos Algo’s Full Live Track Record

    3+ years live. Verified withdrawals on MQL5. Hard portfolio stop at -65%. From $30 lifetime.

    View Chronos Algo →

    Risk Disclosure: Both Chronos Algo and Waka Waka are martingale/grid-based systems. They can open multiple positions with progressively larger lot sizes during adverse market conditions. Past performance does not guarantee future results. The -65% hard stop loss in Chronos Algo limits but does not eliminate loss. All trading of leveraged instruments carries substantial risk of loss and may not be suitable for all investors. This article is for informational purposes only and does not constitute financial advice.
  • Chronos Algo vs Forex Fury (2026): A Straightforward Comparison for Serious Traders

    Chronos Algo vs Forex Fury (2026): A Straightforward Comparison for Serious Traders

    Chronos Algo and Forex Fury are both long-running Expert Advisors with verified live accounts, real user bases, and genuine track records. They are also fundamentally different in how they trade, how they manage risk, and what kind of trader each one suits.

    This comparison covers both EAs honestly — including the risks of each. The goal is to give you the information to make a decision that fits your account size, risk tolerance, and trading goals.


    At a Glance

    Chronos Algo

    • EURUSD · H1 · MT4 + MT5
    • Martingale basket strategy
    • Hard portfolio stop at -65%
    • 3+ years live · Myfxbook verified
    • +233% gain since Aug 2022
    • From $30 · lifetime license

    Forex Fury

    • Multi-pair · MT4 + MT5
    • Range scalping strategy
    • Optional martingale feature
    • Multi-year live · Myfxbook verified
    • 93% claimed win rate
    • $250 · lifetime license


    Strategy: How Each EA Actually Trades

    Chronos Algo — Martingale Basket on EURUSD H1

    Chronos Algo trades EURUSD on the 1-hour chart using a multi-indicator entry filter that requires agreement across Stochastic, ADX, MACD, RSI, CCI, ATR, and Envelopes before opening a position. This deliberate filtering reduces how often the EA enters the market, which limits the frequency of recovery sequences.

    When the market moves against the initial position, the EA opens additional positions in the same direction with progressively larger lot sizes — a martingale basket. Exit logic is tiered: small baskets close at a profit target; larger baskets shift to breakeven exit, closing all positions the moment equity recovers to entry level. This prevents deep sequences from requiring a large profit recovery before closing.

    A hard portfolio stop loss at -65% closes all open positions automatically if account drawdown reaches that threshold. Individual trades carry no per-trade stop — the system manages positions as a basket. The -65% floor defines the absolute worst-case outcome.

    What this means for your account

    On a $1,000 account, the absolute worst-case single loss is $650 — if the -65% hard stop triggers. In practice, the maximum recorded drawdown on the live account is -32.90%, meaning this floor has not been approached in 3+ years of real trading.

    This is also consistent with the backtest record. Across 11 years of backtesting (2013–2024) using 100% real tick data with the same default settings used on the live account, the maximum equity drawdown reached 32.40% — and the -65% portfolio stop was never triggered across the entire period. The close alignment between backtest drawdown (~32%) and live drawdown (~33%) suggests the strategy behaves as expected in real market conditions. Minimum recommended capital is $1,000.

    Forex Fury — Range Scalping During Low-Volatility Windows

    Forex Fury targets brief periods of low market volatility — typically around 4–5 PM EST — and trades within defined price ranges, aiming for small, consistent 5-pip take profits. This narrow targeting approach produces a high win rate (claimed 93%, independently cited as ~91%) by avoiding the volatility of major sessions and news events.

    The EA trades one currency pair per account. Default settings do not attach a stop loss to individual trades. An optional martingale feature is available, which increases lot size after a loss to accelerate recovery — but this can be disabled by the user. Risk settings (low / medium / high) adjust position sizing and exposure.

    What This Means for Your Account

    The high win rate provides strong protection in stable, ranging conditions. In trending or high-volatility markets, the absence of a per-trade stop loss means losing positions can remain open for extended periods. Managing risk settings carefully — and understanding how the martingale option affects exposure — is important before running this EA live.


    Risk Structure: Side by Side

    Factor Chronos Algo Forex Fury
    Core strategy Martingale basket · trend-following Range scalping · low-volatility sessions
    Martingale Yes — core strategy, fully disclosed Optional feature · off by default
    Per-trade stop loss No — basket managed as unit No — by default; configurable
    Portfolio hard stop Yes — closes all at -65% drawdown No published hard stop
    Win rate 77.51% (backtest) · live varies 93% claimed · ~91% independently cited
    Trade frequency Low — multi-indicator filter limits entries Daily — trades ~1 hour per day
    Pairs traded EURUSD only Multiple pairs (one per account)
    Platforms MT4 + MT5 MT4 + MT5
    Prop firm compatible Generally no — martingale restricted Varies — some settings may qualify

    Live Track Records

    Chronos Algo

    Cumulative gain
    +233%
    Since Aug 2022 · MT4 live

    Max drawdown
    32.90%
    Live recorded · hard floor -65%

    Verified withdrawals
    $1,273
    Verified on MQL5

    Live since
    2022
    3+ years continuous

    Chronos Algo has MT4 and MT5 live accounts, both independently tracked on Myfxbook. Verified withdrawals of $1,273.25 on MQL5 confirm that real profits were extracted from the account — not just reflected in an equity curve. The account has run continuously since August 2022 without restart. The backtest covers 2013–2026 with 99.9% tick data, showing a profit factor of 1.99.

    Forex Fury

    Forex Fury has published Myfxbook-verified accounts since 2015 with a claimed 93% win rate and gains exceeding 200% on select accounts. The EA has a large user base of 21,600+ clients. Live results are verifiable on Myfxbook. Performance varies based on broker, settings, and market conditions — as with all EAs, individual results may differ from the published accounts.


    Pricing

    Chronos Algo
    From $30
    Lifetime · per account

    Forex Fury
    $250
    Lifetime · single license

    Chronos Algo is priced per account with a lifetime license. Forex Fury is priced at $250 for a single account license with lifetime updates. For traders running multiple accounts, per-account pricing makes a meaningful difference in total cost.


    Which EA Fits Which Trader?

    You want a defined worst-case loss before you buy Chronos Algo — the -65% hard stop defines the maximum outcome
    You prefer a high win rate with frequent small gains Forex Fury — 91–93% win rate with daily trade activity
    You’re running multiple accounts Chronos Algo — per-account pricing from $30 scales better
    You want to trade multiple currency pairs Forex Fury — supports multiple pairs across separate accounts
    You value a long, uninterrupted live track record Both — each has multi-year verified live history
    You’re starting with limited capital ($100–$500) Forex Fury — lower minimum capital requirement
    You want to verify real withdrawals from the live account Chronos Algo — $1,273.25 in verified MQL5 withdrawals
    A note on prop firm trading

    Both EAs use strategies that may conflict with prop firm rules. Martingale-based systems (Chronos Algo) are generally prohibited by most funded account programs. Forex Fury may qualify with certain settings, but check your firm’s specific rules before using either EA on a challenge or funded account.


    Summary

    Chronos Algo and Forex Fury are built for different trading philosophies. Forex Fury is designed around high-frequency, low-risk-per-trade scalping that wins consistently in calm conditions. Chronos Algo is a trend-following martingale system that trades less frequently but captures larger moves — with a hard portfolio stop that defines the absolute downside.

    Neither EA is right for everyone. The choice comes down to what kind of risk you prefer to manage: the frequency risk of a scalper that needs stable conditions, or the drawdown risk of a martingale system with a defined floor.

    Both have verifiable live track records. Both have been running for multiple years. Both carry real risk — as all leveraged trading systems do. Whichever you choose, understanding the risk structure before you deploy capital is the most important step.

    See Chronos Algo’s Full Live Track Record

    3+ years live. Verified withdrawals on MQL5. Hard portfolio stop at -65%. From $30 lifetime.

    View Chronos Algo →

    Risk Disclosure: Chronos Algo is a Martingale-based system. It can open multiple positions with progressively larger lot sizes during adverse market conditions. A hard portfolio stop loss at -65% is enforced, but this stop can still be triggered in extreme market conditions — resulting in a loss of up to 65% of your account balance. Forex trading involves substantial risk of loss and is not suitable for all investors. Past performance is not indicative of future results. Never trade with money you cannot afford to lose. Always test on a demo account before deploying live. Minimum recommended capital: $1,000. Information on Forex Fury is sourced from publicly available materials and independent reviews; BotFXPro makes no claims regarding its performance or suitability.

  • EURUSD Expert Advisor — What a 3-Year Live Track Record Actually Tells You

    EURUSD Expert Advisor — What a 3-Year Live Track Record Actually Tells You

    There are thousands of Expert Advisors marketed for EURUSD. Most share one thing in common: their track records are short, optimized on historical data, and run on demo accounts. A 3-year live track record is rare. When one exists — and when you know how to read it correctly — it tells you things no backtest ever can.

    Why EURUSD Is the Most Traded — and Most Demanding — Pair

    EURUSD accounts for roughly 23% of global daily forex volume. That liquidity is a double-edged sword for algorithmic traders. Spreads are tight and execution is reliable. But the pair is heavily analyzed by institutional players, which means shallow technical patterns get arbitraged away quickly.

    An EA that performs consistently on EURUSD over multiple years has survived through multiple market regimes: low-volatility ranging, trending dollar cycles, and high-impact events like central bank policy shifts. That breadth of exposure is what separates a robust strategy from a curve-fitted one.

    Understanding Martingale — What It Actually Means

    Most traders have heard “martingale” and immediately think of blowup risk. That reaction is reasonable — uncontrolled martingale systems have wiped accounts. But the label covers a wide range of implementations, and the risk profile depends entirely on how the system is designed.

    A martingale EA increases position size after a losing trade. The logic is that a recovery win covers the accumulated losses. The critical variable is: what stops the drawdown from compounding indefinitely?

    In a well-engineered martingale system, there are two answers to that question:

    Tiered exit logic. When a basket of positions is small (3 or fewer open trades), the system closes at a profit target. As the basket grows larger (4+ open positions), the exit logic shifts — the system closes the entire basket the moment equity returns to breakeven. This prevents a large losing sequence from needing a full recovery profit target to close.

    Portfolio stop loss. A hard stop at the portfolio level — not on individual trades — closes all open positions if equity drawdown reaches a defined threshold. The stop loss is not attached to individual orders, because in a martingale system where positions are managed as a basket, per-trade stops would interfere with recovery logic. The portfolio stop exists to define the absolute worst-case scenario.

    What 3 Years of Live Data Shows You

    When evaluating a EURUSD EA on Myfxbook, here is what actually matters:

    1. Drawdown through adverse periods

    Chronos Algo has recorded a maximum drawdown of -32.90% over 3+ years of live trading. For a martingale system, this is the number that defines the real risk exposure. The portfolio stop loss is set at -65% — meaning the absolute worst-case the system is designed to accept is a 65% equity decline before all positions close automatically.

    In 12+ years of backtesting and 3+ years of live trading, that -65% stop has never been triggered.

    2. Consistency across years — not just the best year

    A strategy that made 80% in year one and lost 30% in year two is not a 50% net gain story — it is a volatile strategy. Look for annual returns that are relatively consistent: modest gains in difficult years and stronger gains in favorable conditions. Smooth gain growth across time is more meaningful than dramatic peaks.

    Chronos Algo MT4 — Gain chart 233%+ verified by Myfxbook
    Chronos Algo MT4 — Cumulative gain 233%+ since August 2022. Verified by Myfxbook.

    3. Trade frequency and basket behavior

    Chronos Algo trades EURUSD H1. Trade frequency is relatively low — the system waits for conditions across multiple indicators (Stochastic, ADX, MACD, RSI, CCI, ATR, Envelopes) to align before entering. This reduces the number of losing sequences that trigger martingale recovery, which directly limits maximum drawdown exposure.

    4. Withdrawal history

    Verified withdrawals are the most credible proof that an account is live and that profits have actually been extracted. Check the Myfxbook withdrawals field. Chronos Algo shows $1,273.25 in verified withdrawals over its live run — money that actually left the account.

    How the Risk Controls Work

    Portfolio stop loss at -65%
    Individual trades do not have stop loss orders attached. The system manages positions as a basket, and attaching stops to individual trades in a recovery sequence would close positions at the wrong time. Instead, the EA monitors total equity continuously. If drawdown reaches -65% of starting equity, all open positions are closed immediately. This is a hard rule built into the EA logic.

    Lot sizing via AutoLot
    Default sizing is 0.01 lot per $1,000 of account equity. This scales position size proportionally to the account, so drawdown percentages remain consistent regardless of account size.

    Holiday filter
    The EA includes a configurable time window for trading. By default, it avoids trading during the Christmas–New Year period when market volume drops significantly and spread behavior becomes unreliable. Users can configure additional trading exclusion windows manually if they want to avoid specific sessions or periods — but this is a manual configuration, not an automated news filter.

    The Difference Between Optimized and Robust

    An optimized EURUSD EA is built by running thousands of parameter combinations on historical data and keeping the settings that performed best in the past. Markets change, and parameters optimal for one volatility regime often fail in another.

    A robust system uses logic that holds across different conditions. Chronos Algo uses a multi-indicator entry filter specifically to reduce false signals — requiring agreement across trend, momentum, and volatility indicators before a position opens. This directly reduces the frequency of losing sequences that force the martingale recovery mechanism to engage.

    The fastest way to assess robustness is out-of-sample performance. If live trading after release closely tracks the backtest, the strategy is likely robust. Chronos Algo has been running live since August 2022 with performance consistent with 12-year backtest characteristics.

    Chronos Algo Backtest Results 2013–2026 — Profit Factor 1.99, Win Rate 77%
    Chronos Algo backtest 2013–2026 — 100% real tick data, Profit Factor 1.99, Win Rate 77.51%, Total Net Profit $141,337 from $1,000 initial deposit.

    How to Verify Before You Buy

    Step 1 — Confirm the account is live, not demo.
    Myfxbook displays account type clearly. Chronos Algo MT4 is a verified live account at IC Markets.

    Step 2 — Review the gain chart, not just the equity curve.
    The gain % chart shows cumulative growth from starting capital. Chronos Algo shows 233%+ gain over the live run. The equity curve shows balance including open floating positions — in a martingale system, these will diverge during recovery sequences, which is normal and expected.

    Step 3 — Check the drawdown chart.
    Maximum recorded drawdown: -32.90%. This is the real risk profile. The -65% portfolio stop defines the absolute ceiling.

    Step 4 — Verify withdrawals.
    $1,273.25 withdrawn from a live account means real money was extracted. This is not possible on a demo account.

    Step 5 — Confirm broker conditions.
    Chronos Algo runs on IC Markets with raw ECN spreads. If you run it on a high-spread broker, performance will differ. ECN/raw spread brokers (IC Markets, Pepperstone, Exness) recommended.

    Chronos Algo Myfxbook Stats — Gain 233.65%, Drawdown 32.90%, Withdrawals $1,273.25
    Chronos Algo MT4 live account stats on Myfxbook — Gain +233.65%, Max Drawdown 32.90%, Verified Withdrawals $1,273.25.
    Chronos Algo Monthly Profit — MQL5 Live Trading Signal
    Chronos Algo monthly profit breakdown from MQL5 live trading signal — consistent returns across years.

    The Bottom Line

    A 3-year live EURUSD track record with a martingale system is only worth serious consideration when the risk controls are clearly defined and verifiable. What matters is not whether the system uses martingale — it is whether the worst-case scenario is bounded, transparent, and has been consistently avoided over the live run.

    Chronos Algo’s -65% portfolio stop has never been triggered. Maximum live drawdown is -32.90%. Withdrawals are verified. The gain trend is consistent across years.

    That is the checklist. Chronos Algo passes it.

    View Chronos Algo →

  • Why Most Forex EAs Fail(And How to Find One That Doesn’t)

    Why Most Forex EAs Fail(And How to Find One That Doesn’t)

    The statistics on forex EA failure are not encouraging. Most automated trading systems stop working within 12–18 months of release. Many blow accounts within weeks of going live.

    But some systems run for years, generate real profits, and survive multiple market cycles.

    The difference usually comes down to one thing: how losses are handled.


    The Core Problem: Manufacturing a Good Track Record

    The easiest way to build a forex robot with an impressive-looking track record is to remove the stop loss.

    Without a stop loss, a losing trade is never closed. Instead, it sits open — accumulating loss — while the equity curve shows a smooth upward line from closed trades. When you look at the stats, all you see are the winning positions.

    This approach has many names: martingale, grid trading, averaging down, hedging with correlated positions. The mechanics differ, but the principle is the same: losses are hidden, not managed.

    It works until it doesn’t. A sustained trend against the open positions triggers a margin call, and the account is gone.


    Why Martingale Feels Safe (Until It Isn’t)

    Martingale strategies add to losing positions. If you’re down on a trade, you open another in the same direction with a larger size. If the market reverses, the combined position closes at breakeven or better.

    In a ranging market, this can work for a long time. Win rates above 90% are common because most small reversals get recovered before closing at a loss.

    The problem is that trend markets — especially in currency pairs or gold — can move in one direction for weeks. At that point, martingale systems don’t recover. They compound the loss with each new addition until the account is exhausted.

    The win rate looks great right up until the account blows.


    What “No Martingale, No Grid” Actually Means

    A forex EA that uses no martingale and no grid has a fundamentally different risk profile:

    • Every trade has a hard stop loss — if the trade goes wrong, the loss is fixed and finite
    • Position sizing is independent per trade — a loss on one trade doesn’t affect the size of the next
    • Drawdown is bounded — the worst case is a series of losses at the defined risk per trade, not an exponential blowup

    The tradeoff is that win rates tend to be lower — typically 50–65% rather than 85–95%. But a 60% win rate with a 1.5:1 reward/risk ratio is sustainably profitable. A 95% win rate with unlimited downside is not.


    How to Verify a System’s Risk Approach

    Before purchasing any EA, check these specific things:

    1. Check the open trades section on Myfxbook

    If the live signal shows multiple open trades stacked in the same direction at different price levels, it’s a grid or averaging system — regardless of what the marketing says.

    2. Look at the maximum drawdown

    A martingale system will show a very low drawdown until it blows. But if you look at the floating drawdown on open trades, you’ll often see large unrealized losses.

    3. Ask directly

    Email the vendor and ask: “Does every trade have a hard stop loss sent to the server at the time of entry?” A legitimate vendor will say yes. An evasive answer is a red flag.

    4. Check the trade history

    Download the full trade history from Myfxbook and look for the stop loss value on every trade. If it’s blank or zero, the system has no hard stop.


    The Long-Term Advantage of Hard Stop Losses

    Systems that use hard stop losses have one major structural advantage: they survive.

    A martingale system that runs for 2 years might look better than a hard-stop system over the same period. But the martingale system carries the risk of a single catastrophic event that destroys everything. The hard-stop system takes smaller, defined losses and continues operating.

    Over a 5–10 year horizon, the compounding effect of a consistently profitable, risk-managed system significantly outperforms a high-win-rate system that blows once every few years.

    This is why institutional traders don’t use martingale. Position limits, risk per trade, and hard stops are standard practice — not because they maximize short-term performance, but because they preserve capital for the long run.


    EA strategy types — risk comparison

    What to Look For

    Strategy TypeWin RateRisk ProfileLongevity
    Martingale / Grid85–95%Unbounded lossShort (blows eventually)
    Hard SL, no averaging50–65%Fixed risk per tradeLong (survives drawdowns)

    When you find an EA with a multi-year live track record, hard stop losses on every trade, and no grid or martingale — that’s the rare system worth your attention.


    Looking for an EA with hard stop losses, no grid, and no martingale on every trade? The Gold Trend Accelerator Combo runs 7 independent strategies on XAUUSD — each with a hard SL, zero averaging, and zero grid logic. Learn more →